Overview of the Company
Comcast is an American telecommunications multinational based in Philadelphia. In terms of revenue, the corporation is second only to AT&T among broadcasting and cable television providers worldwide. Additionally, with a market share of $154.28 billion, it is the largest pay-TV and cable provider, home internet provider, and third-largest supplier of home telephone service in the United States (Journal, n.d.). Comcast runs and owns the cable communications company Xfinity as well as over-the-air national broadcast networks such as NBC and Telemundo. It also runs several cable-only networks, including MSNBC and CNBC. Comcast is an immensely large and diverse firm with operations in various sectors, all linked via telecommunications and television entertainment.
Income Statements
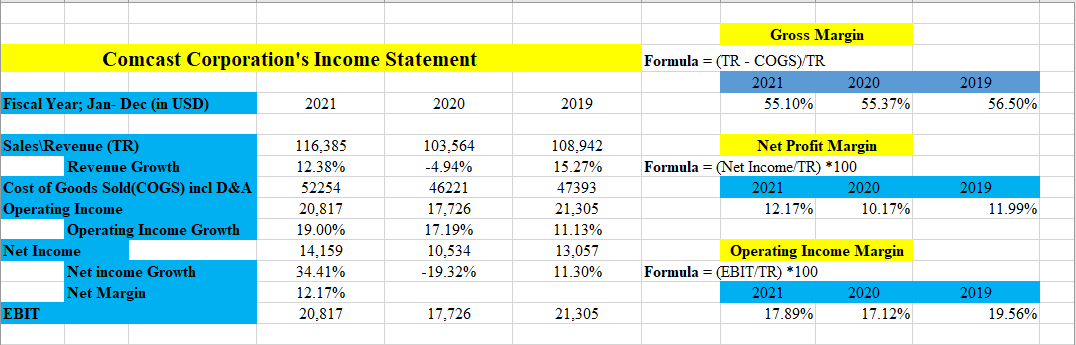
Comcast was greatly affected by the pandemic as evidenced from the decline in revenue in 2020. The company experienced a drop in total revenue from $108,942 (15.27%) in 2019 to $103,564 (-4.94%) in 2020 due to the decline in total sales (Journal, n.d.). However, 2021 saw the organization register a 12.38% increase in revenue from the previous year amounting to $116,385. Likewise, Comcast experienced a drop in its net income from $13,057(11.30%) in 2019 to $10,534 (-19.32%) in 2020 (Journal, n.d.). However, there was a rise in the net income to 14 159 (34.41%). The operating income dropped in 2020 by 17.19% but rose by 19% in 2021 to $20,817.
Table 1: Comcast Corporations Income Statement between 2019 and 2021
Common Size Income Statements
From table 1, Comcast corporation experienced slight fluctuations with regard to the gross, net profit, and operating income margin. There was a drop in net profit margin from 11.99% to 10.17% in 2019 and 2020, respectively, after which it rose to 12.17% in 2022 (Journal, n.d.). The decline is a result of the difficulties and inefficiencies the company faced in converting sales into profits, mainly due to the COVID-19 restrictions. Furthermore, there was a slight drop in the gross margin from 56.50% in 2019 to 55.37% in 2020, which remained constant. This decrease resulted from a decline in overall sales due to travel restrictions; hence, inventory stock was up. Similar to the gross margin, the operating income margin also slightly decreased from 19.56% in 2019 to 17% in 2020 and 2021, which can also be attributed to the decline in sales (Journal, n.d.). The operating income margin is a measure of profitability; therefore, the drop and low operating income observed over the three years indicate low profitability for the company.
Balance Sheet
Table 2: Comcast Corporations Balance sheet between 2019 and 2021
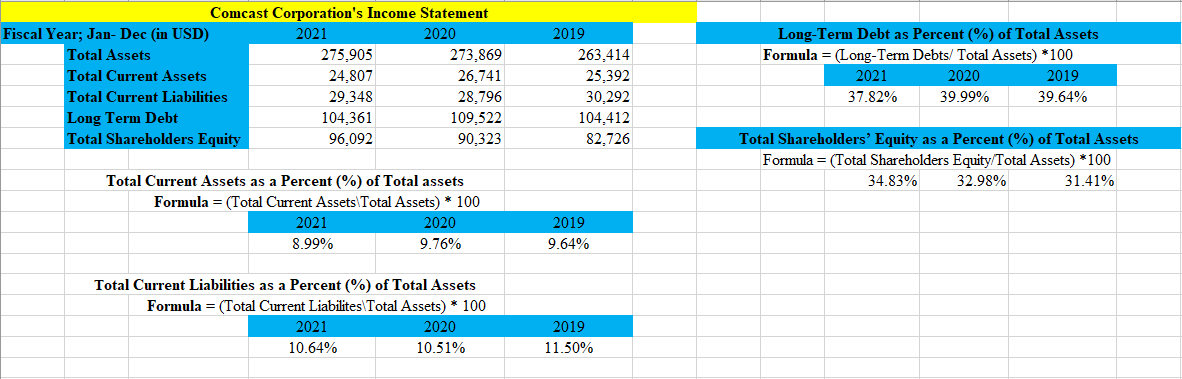
From table 2, the company experienced an increase in its total assets from 2019 to 2021. However, for the total current assets, there was an increase from $25,392 in 2019 to $26,741 in 2020, after which it dropped to $24,807 (Journal, n.d.). On the other hand, the total current liabilities dropped from$30,292 in 2019 to $28,796 in 2021 and rose again to $29,348 in 2021. Like total current assets, the long-term debt rose to $109,522 in 2020 and dropped to $104,361in 2021. Finally, the company experienced a positive increase in the total shareholder’s equity from 2019 to 2021.
Common Size Balance Sheet
Table 2 illustrates Comcast’s common size balances sheet between 2019 and 2021. In 2019, the current assets as a percentage of assets stood at 9.65%. The total current assets stayed relatively constant in 2020 at 9.76% (Journal, n.d.). However, in 2021, Comcast’s current assets slightly dropped to 8.99%. Comcast’s current liabilities were 11.50% of total assets, decreasing to 10.51% in 2020 and slightly increasing to 10.64% of total assets in 2021. Comcast’s long-term debt was 39.64% of total assets in 2019, 39.99% in 2020, and 37.82% in 2021 (Journal, n.d.). Finally, the company total shareholders’ equity stood at 31.41% of total assets in 2019, increased to 32.98% in 2020, and further increased to 34.83% in 2021.
Cash Flow
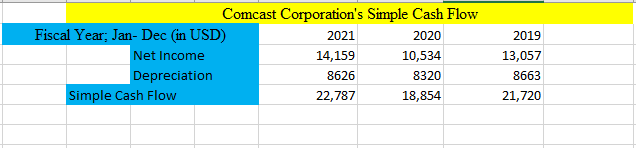
The last three years have seen Comcast’s simple cash flow increase and decrease, as shown in table 3. The company’s simple cash flow was $21,787 in 2019, fell to $18,854 in 2020, and grew in 2021 to $22,787 (Journal, n.d.). As reported on Comcast’s cash flow statement, the net cash flow from operating activities followed a similar pattern, as shown in table 4. The net cash flow from operating activities was $25,697 in 2019, decreased to $24,737 in 2020, and increased to $29,146 in 2021 (Journal, n.d.). The higher reported amounts are due to the positive cash flow from the working capital changes.
Table 3: Comcast Corporation Simple Cash Flow
Where;
![]()
Hence;
For 2021, the simple cash flow is given by;
Simple Cash Flow = 14,159 + 8626 = 22,787
For 2020;
Simple Cash Flow = 10534 + 8320 = 18, 854
and for 2019;
Simple Cash Flow = 13,057 + 8663 = 21, 720
Table 4: Comcast Corporation Net Cash Flow from Operating Activities

Financial Analysis Conclusion: Strengths and Weaknesses
On the financial statements, Comcast’s 2021 fiscal year illustrates several strengths. First, the revenues, net income, and operating income are increasing compared to the previous years. Additionally, the company’s operating and gross margins are improved compared to 2020 and 2021. These trends are further echoed in Comcast’s growth in total assets. The company’s main weakness is the current liabilities, both on a nominal basis and as a percentage of the total assets in 2020.
Table 5: Weaknesses and Strengths
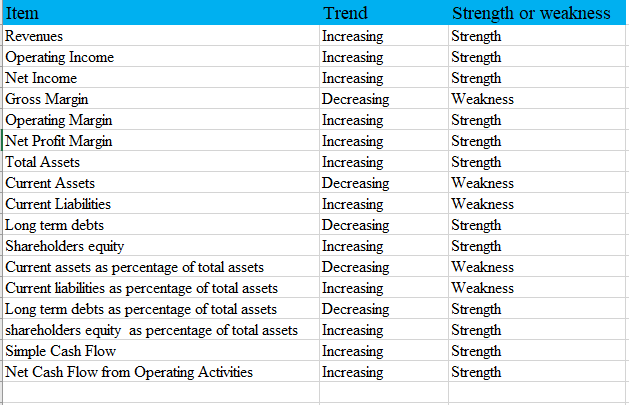
In general, Comcast’s financial performance is strong. The increasing revenues, earnings, margins, and cash flows are clear indications of a healthy business. Even though the company has increased current liabilities, the increasing cash flows should be sufficient to cover any additional debts.
Reference
Journal, W. S. (n.d.). CMCSA | Comcast Corporation. Cl a financial Statements – WSJ. The Wall Street Journal. Web.