Nowadays, when companies extend rapidly, the issue of optimal office layout has become especially relevant. Throughout the history, a number of approaches have been elaborated to create a productive and comfortable working environment. While it is desirable that employees feel better at work, the emphasis on productivity in designing offices has been made. The issue of enhancing employees’ effectiveness in mapping office space has presented a challenge over the years. This research project aims to develop an office layout for a particular company that will increase the employee productivity and reduce the potential lean wastes. The main method used in this project is DMAIC methodology and in each phase Lean Six Sigma tools and techniques will be implemented. The expected finding of the project includes designing an efficient layout that would allow the company to boost its effectiveness through enhancing employee productivity and reducing lean wastes.
Introduction
In the realities of the modern world, people spend a huge amount of time at work. To make their working process effective, there is a whole industry of office, business centers, the areas of which include the place of work itself as well as related premises such as cafeterias, studios, and workshops. Competent layout of these areas and spaces ensures not only a safe stay of a person in the workplace, but helps to increase the efficiency of work in the whole enterprise, which is the ultimate goal of office space design. Designing offices and office centers is an essential area of engineering, affecting both the life and needs of one particular person and the whole enterprise. The specifics of designing office centers combine several areas of engineering solutions and technologies. When constructing office centers, everything is subject to detailed study – architectural and structural solutions, engineering networks, fire safety, because these sections of the design greatly affect the subsequent work productivity and safety of people in these buildings and structures.
This project is focusing on designing a new facility layout to achieve the company’s goals. The company employs many technical and administrative employees, the number of which is constantly growing and results in crowded work spaces and subsequent decrease in employees’ satisfaction and productivity of their work. At present, several company’s departments are divided into two different locations due to the absence of space for all employees in one area; this situation leads to miscommunication and misunderstanding between the workers. In addition, it affects the employee performance, attendance, and safety. To combat this situation, the company commissions building a new extension to shift administrative employees there and wants it designed based on the departments’ needs.
The project comprises several stages: preparatory stage aimed at collection of initial data and management’s wishes; design concept; design project; and architectural and construction section. Moreover, heating, ventilation and air conditioning considerations that are not a part of this project will have to be added before the building is fully completed. Preparatory stage includes identifying the employees’ needs and developing a plan of building with arrangement of equipment, as well as establishing the total capacity and suitability of the potential premises for the needs of the company (Andrade & Bragança, 2019). Design concept presupposes visualization of the main functional areas and determining an estimated cost of the project.
Design project is developed on the basis of design concept and consists of measurements of the building; design solution with indication of all the necessary dimensions of premises; a plan with the arrangement of furniture and equipment. Moreover, it comprises six sigma DMAIC methodology with engineering tools (Abualsaud et al., 2019). Architectural and construction section is the optimal set of working drawings necessary and sufficient for obtaining a construction permit and carrying out construction work (Rezaei et al., 2019). Finally, heating, ventilation and air conditioning considerations that are to be examined after the project is finished include determining the capacity of heating and air conditioning system, axonometric scheme, and specification of equipment and materials. The contribution of this project lies with the fact that the new extension will allow employees to have a more comfortable workplace that will boost the effectiveness and productivity of their work.
Literature Review
The importance of comfortable working environment and the necessity to design spacious office layouts has long been recognized. The office layout is understood as the proper location of workplaces, open spaces, meeting rooms, and offices. The office layout project begins with the development of planning solutions and the construction of logistics communications between the departments of the company. At the first stage of design, office layout options are created and the concept of the idea of the future office project is being worked out. The layout options include the design of public spaces: reception areas for partners and visitors, meeting rooms, workrooms, open space, and executive offices.
Researchers stress the interconnection between comfortable work space, productivity, and effectiveness and focus on effects of ambient environment features in employees’ job satisfaction (Lee & Brand, 2005; Öhrn et al., 2021; Solomon, 2018). The studies found that removing partitions and small offices and replacing them with large areas often facilitates interaction and cooperation between employees. This approach can be especially useful for departments that rely on creativity to solve operational and marketing issues. Among the factors that have a direct impact on employee’s productivity, researchers name low noise levels, good light, décor elements such as plants, rugs and pictures, non-linear placement of furniture, adequate ventilation and heating issues (Lee & Brand, 2005; Öhrn et al., 2021; Solomon, 2018). However, it has been found out that location of offices, departments, equipment, and tools have a major effect on employee productivity, while décor elements have a low effect. That is why nowadays office layout is seen as a determining factor in enhancing employees’ productivity and must be primarily considered when planning to build an extension for the company.
Practices of Designing Office Layouts
Designing offices has long been seen as a major part of office building; however, it’s very concept during the years has undergone significant changes. Initially seen as any premises where any amount of work could be done, offices have transformed from dim crampy places into spacious suites suitable for business meetings and presentations. Seitz (2019, p. 5) states that transformation of office space began with “the proliferation of paperwork associated with the Industrial Revolution” as the quantity of the administrative work increased. In the first part of the twentieth century, offices were seen as crampy spaces with numerous desks for employees. The design left little room for movement and comfort of employees with the focus of sitting as many people as possible into limited spaces. The desks conformed to straight lines and no room for décor elements was provided. The first changes were introduced with the development of Bürolandschaft office design concept in 1958 that “entailed the strategic arrangement of large open-plan spaces, with desks and plants placed at odd angles to break up sightlines, carpeting and acoustic ceilings to absorb sound, and sophisticated heating and cooling systems maintaining an even temperature”. (Seitz, 2019, p.7) This design was seen as more employee-friendly as it allowed more room for self-reflection, which ultimately translated into higher productivity.
The next step of evolution of office design comprised making partitions to enhance employees’ privacy. The best-known concept of this design is the cubicle, a relatively small space with a table and a computer surrounded by walls of grey fabric panels (Beno, 2021). While ensuring privacy, cubicles did little to boost employees’ performance since the enclosed space made people feel depressed and gloomy. Due to this, in the 1990es, office designs underwent a transformation towards an open plan office designs. Open plan office is the layout of a workspace where there are no walls as such. The only exception may be the executive offices with glass walls. The transparency of the partitions supports the concept of an open plan office (Beno, 2021, Seitz, 2019). The advantages of such a layout lie with the easy interaction between departments, openness and transparency of working processes. Moreover, it facilitates communication, though privacy issues may be compromised.
Nowadays, after the COVID pandemic, the concept of facility designs has undergone significant transformation. Design solutions of modern offices are moving towards transformable multifunctional spaces. The same room can be a meeting room, a collaboration area with a podium and marker boards, a training class or a gathering place for all employees (Kaufmann-Buhler, 2021). Such a request for mobility of solutions is born due to the rapid mobility of employees: one day a hundred employees may come to work, and the other one hundred and fifty. More and more people work and do not need a fixed office space. Managers try to anticipate these risks and ask to create a space without walls, using mobile partitions that two people can take and simply move, if necessary. An increase in the proportion of those who work remotely requires appropriate office equipment. Screens, cameras, microphones, interactive electronic boards with the possibility of collaboration should be installed in meeting and conference rooms (Pimenova, 2019). Moreover, Plexiglass or glass screens separating managers from customers and visitors from each other, have become widely used in 2020. Furniture manufacturers are working to ensure that offices after the coronavirus are not only safe, but also stylish. Another modern trend is the inclusion of natural elements in the interior of the office (Gnedina et al., 2019). It is not simply beautiful: the abundance of plants, the use of natural materials and sufficient natural lighting have a positive effect on the physical and mental health of employees, their performance.
The Impact of Office Layouts on the Employee Productivity
Due to the fact that a number of approaches have been adapted to development of office design, such as cubical offices, open-space offices or modern transformational offices, researchers cannot come to an agreement as to the optimal features modern facility layout should have to boost employees’ productivity. Moreover, the methods through which such a layout can be designed differ greatly in different studies. Thus, Reggasa (2013, p.54) emphasizes the necessity of “the layout problem—placing the manufacturing resources (machines, departments, or cells) within the available floor area” and “the determination of the network system to support material flow interaction between facilities”. The method she recommends is the simulation of process flow, which presupposes the creation of a mathematical-logical model of a real layout and then subjecting this model do different tests using computer-based programs. Liggett (2000) sees the most important layout factor that enhances productivity in assigning different activities to different locations done through the use of automated space allocation algorithms. Ali Naqvi et al. (2016) stress the importance of ‘lean manufacturing’ which they consider the combination of material flow that allows to get rid of storage spaces with the increased efficiency of workforce. Wei et al. (2019) highlight the importance of creating flexible environments that will allow the enterprise to reduce costs when changes have to be made. The methods proposed to design such layouts is ‘a chaotic generic algorithm with improved Tent mapping’ that allows to model the space in different time settings and improve its effectiveness.
LSS Practices in Employee Productivity
“Lean” is a methodology aimed at increasing productivity and eliminating steps that do not add value. “Six Stigma” is a set of tools for continuous improvement of the process and may be seen as an approach to improving performance, based on obtaining information about the variability the capabilities of the process (Singh & Rathi, 2018). Simultaneous use of these technologies allows to save time, improve labor productivity, reduce the number of errors, and at the same time increase the amount of work performed. The “Lean” technology has been widely used to increase productivity of workforce within different companies and aims to reduce the speed of any process by reducing six types of losses. These processes include excessive processing, multiple and unnecessary transportation, excessive movement of personnel, excessive commodity material stocks, time delays, and overproduction (Singh & Rathi, 2018). With the help of Lean Six Sigma tools, the process flow and the delay time during each individual operation are analyzed. At the same time, steps that add and do not add value are identified. These actions help to get rid of operations that do not add value and the costs associated with them. Minimizing the excessive complexity of the process and standardizing it helps to save resources and eliminate the possible defects.
The Six Sigma system is an active approach to improving the performance of the enterprise. One of the methods of solving problems in the Six Sigma system is the approach DMAIC. This approach provides the process improvement team with a specific action plan. “Lean” and “Six Sigma” are complementary elements: the introduction of “Lean” and “Six Sigma” tools in the DMAIC approach makes it possible to target the project at the same time to eliminate losses and variability (Madhani, 2022). The combination of these approaches works well for assessing the productivity of workforce allowing the managers to determine the company’s lean wastes and at the same time to determine the roots behind the lean wastes problem. Though few studies describe the application of LLS practices in developing an optimal office layout, the potential lean wastes in office environment have been well defined. They include excessive personnel movement, when employees have to move between departments to solve tasks; unnecessary transportation of documents and facilities from one department to another; time delays due to inadequate office layout, and overproduction (Madhani, 2022). The development of an optimal office layout is aimed at reducing these lean wastes by improving the productivity of workforce.
Technological Solutions in Office Layouts
The rapid development of technological progress makes the use of technologies in planning office layout more and more mandatory. Visualization within the framework of interior representation is a photorealistic perspective image that allows seeing the design solution of the projected space or even several interconnected buildings (Bingkun & Hong, 2018). The visualization method allows to immerse in the future interior, evaluating its advantages and identifying disadvantages. This significantly reduces the risk of implementing a project that ultimately will not meet the needs and requirements. LSS Practices mentioned earlier are also instrumental.
Virtual reality is understood as a world created with the help of modern technologies that recreates all the sensations of being in a space created with the help of computer graphics and third-party programs. Virtual reality creates an object completely, and this process requires a good technical base. In order to recreate office layouts engineers use sophisticated software that allows them to create realistic projects. The project is created using special software, such as the program “3ds Max” in combination with add-ons such as “V-Ray” or “Corona Renderer” (Juan et al., 2019). There are also programs that do not require any additions, as they comprise the means for immersion in virtual reality – “Planoplan”, “HomeByMe”. The created project is demonstrated to the client with the help of special software and auxiliary equipment: a VR helmet or virtual reality glasses. Virtual reality and visualization allow to evaluate the solutions in terms of quality, efficiency, and flexibility. To this end, simulation and optimization methods can be used.
Simulation is an effective method of developing a design solution, characterized by innovation, technological realism, and ergonomic validity. Simulation is able to indicate the need to change the overall design and provides for minimizing of errors of the drawing-orthogonal design method. Optimization is understood as practical calculation of optimal options and, in projecting office layouts bears the abbreviation ADO (Architectural design optimization) (Naili et al., 2022). ADO is a group of optimization methods for training and assistance in finding solutions to the problem of layout planning. Modern engineers who deal with determining the parameters of the project, use computational mathematics. The new claimed software tools allow designers to conduct a comprehensive analysis and determine the content of the project with scripting tools.
Data driven Techniques in Office Layouts
Value Stream Mapping (VSM) is a systematic approach to visualizing the steps needed to create value. It allows one to quickly realize that the steps to create value within DVS, such as creating code and components, deployment and testing, take only a small part of the total time of value delivery (El Kammouni et al., 2020). The first step of the approach is the visualization of all stages in the development Value Stream. The second step is to identify all the people who participate in one or another stage of DVS. The third stage is the measurement of the parameters of the development Value Stream. After these steps, the final metrics are completed and the results of the calculations show how the developed Value Stream works as a whole. Another data-driven method is Lean Six Sigma 4.0., which is “a synergistic [method] between LSS and Industry 4.0” (Antony et al., 2022, para 3.). Antony et al. (2022) state that “companies having a strong LSS culture can ease the transition to Industry 4.0 while Industry 4.0 technologies can provide superior performance for companies who are using LSS methodology” (para 5). This technique allows to combine the best practices of LSS and Industry 4.0 technologies significantly improving the project output.
Research Gaps
While Lean Six Sigma method had been widely used to assess the measures needed to boost employee productivity, few studies describe the application of the method for designing an office layout. Meanwhile, an optimal office layout plays a key role in enhancing productivity of the working processes of any company. The gap in the knowledge related to the virtual absence of data concerning the application of designing office layouts has long been recognized. This project aims to close this gap by designing an efficient office layout using Lean Six Sigma techniques.
Research Value
The abundance of different approaches raises the question as to what an optimal layout should be and through what methods it can be achieved. This research sets the task of determining an optimal layout for the company’s facility as well as the method suitable for building an extension to it. The research aims to combine the mentioned above elements and work out a layout that would at the same time be comfortable and stimulating for workforce. While the strength of other studies lies with the fact that a variety of settings and designs have been developed, the drawback is that there is no universal approach that can be used for similar facilities (Liggett, 2000; Wei et al., 2019). That is why, the project will have to be developed from scratch using the solutions outlined in scientific literature. Moreover, it is essential to bear in mind that each project is unique and aims to meet the needs of particular group of managers and employees which necessitates finding the right properties and methods used.
While the proposed techniques, such as simulation of process flow, automated space allocation algorithms, and lean manufacturing help to tackle the problem of design layout from different perspectives, their usage in my project is limited due to the specific tasks set by the managers of the company. The novelty of this research lies with the method used for design which is six sigma DMAIC methodology with engineering tools. Though this methodology is a common way of designing production processes, there are few studies as to how it can be used for office space design. This project aims to close this gap in knowledge by applying six sigma DMAIC methodology with engineering tools in designing an office extension for the company, explaining the advantages and disadvantages of the method. Moreover, the difficulties encountered in the implementation of this method will be outlined for future researchers to work on the improvement of this project’s techniques.
Research Purpose, Objectives and Scope
Research Aim
This research project aims to develop an office layout that increases the employee productivity and reduces the potential lean wastes.
Research Objectives
The following research objectives clarify the purpose behind conducting this project, which will guide in achieving the study aim:
- To identify the factors that affect employee productivity.
- To identify the best practices of office layout.
- To assess and improve the current working environment.
- To design an improved facility layout that satisfies the current needs and future demands.
- To evaluate the impact of the new layout on employee productivity.
Research Scope
The specifics of designing office layout are such that they cover and combine several areas of design making up a whole range of engineering solutions and technologies. When designing office centers, architectural and structural solutions, engineering networks and fire safety should be considered because these sections of the design greatly affect employee productivity. The scope of this research embraces layout solutions as well as engineering networks, while fire safety, water, heating and ventilation systems are out of the scope of this project. They will have to be further elaborated once this project is finished.
Employee productivity will be assessed in terms of communication between departments and reducing time wasted whether on going between the departments or on accommodating the necessary materials such as paper documents, necessary appliances, computers and so on. For the aims of this project, lean waste will be considered as hindrances to productivity in terms of time and resources and their possible allocation. Working environment will be considered as working space within which business activities of the company take place.
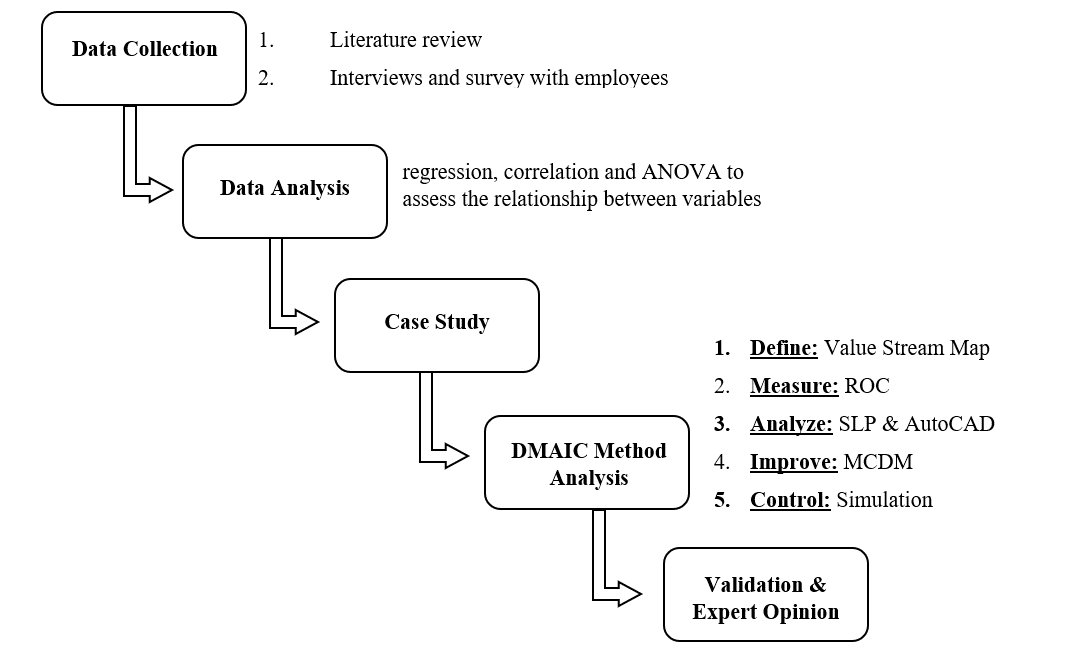
DMAIC is a part of Lean Sigma technique that will be chosen as a method of office layout development. The key components of this research include data collection, data analysis and case study. The main feature of this tool is that it allows finding a permanent solution to the problem of improved office layout in the long term.
Methodology
The DMAIC methodology will be used as a Project Execution Methodology and in each phase Lean Six Sigma Tools and Techniques will be implemented. Six Sigma is an innovative quality system based on process improvement through the search and elimination of the causes of errors that take into account the output parameters critical for the customer. “Six Sigma” is considered a systematic, scientific, statistical and smart approach to innovation management based on the knowledge or the information. The essence of “Six Sigma” is the integration of customer, process, workforce and strategy in such a way as to ensure innovation management (Abualsaud et al., 2019). Six Sigma provides a scientific and statistical basis for assessing the quality of the proposed layout by measuring the quality level. The Six Sigma method allows comparisons between all the possible variants and shows the best of them. The DMAIC methodology which is a primary method used for developing a layout in this project, includes the following stages: data collection, data analysis, and case study. Each of these stages will be examined in more detail.
Data Collection
Data collection would include literature review of how office layout are made and what tools can be used to develop an optimal one. Moreover, data collected for this project would include collecting information about the desires of the company’s management in terms of optimal layout and information as to the difficulties the employees experience in present settings.
Data Analysis
The analysis of data presupposes finding deficiencies in the present layout setting and proposing ways to override them; the proposed ways should be assessed in terms of sustainability, eco-friendliness and employee and management satisfaction. To achieve these aims, statistical analysis will be used, including such tools as regression, correlation and ANOVA. In statistical modelling, regression analysis is a study used to assess the relationship between variables. This mathematical method focuses is on the relationship between the dependent variable and one or more independent ones. More specifically, regression analysis helps to understand how the typical value of a dependent variable changes if one of the independent variables changes while the other independent variables remain fixed. Correlation analysis is a statistical method that allows using correlation coefficients to determine whether there is a relationship between variables and how strong it is.
The purpose of ANOVA analysis is to check the significance of the difference between the averages in different groups by comparing the variances of these groups. Dividing the total variance into several sources allows comparing the variance caused by the difference between groups with the variance caused by intra-group variability. The hypothesis being tested is that there is no difference between the groups. If the null hypothesis is true, the estimate of the variance associated with intra-group variability should be close to the estimate of the intergroup variance.
Case Study
The DMAIC case study focuses on identifying, clarifying and solving the root problem of the process. The case study aims to identify the problems of the project as well as problems the company faces in terms of current layout and its influence on productivity. The effectiveness of a case study is easy to measure, taking into account the fact that the set of phrases is pre-determined and, therefore, by evaluating the effectiveness of each phase, one can measure the effectiveness of the entire process (Abualsaud et al., 2019). Moreover, DMAIC implies a gradual transition from a general understanding of the problem to its most effective solution, with minimal costs. A case study includes such phases as define phase, measure phase, analyze phase, improve phase, and control phase.
Define Phase
In the define phase, the scope of the project will be determined and its goals will be outlined. Interviews and surveys will be used to study the deficiencies of a current layout and to determine what improvements the company visualization in the new one. Value stream mapping will be used to identify the wastes. A value stream map is a graphical representation of all the necessary actions or operations, from layout development to its implementation in stone and concrete (Ramani & KSD, 2019). Drafting value stream map will allow identifying the main production losses and, more importantly, finding the causes of these wastes. The value stream map is the basis for implementing improvements.
Measure Phase
To measure available area and the number of employees in each department as well as determine the key prerequisites of forming an optimal layout, basic data will be collected. These data include the number of departments, the number of sections in each department, the number of employees in each section, the number of secretaries for each manager, and types of storage for each department. Then the information obtained in value stream mapping is used to generate Rank Order Clustering Algorithm (ROC). ROC uses independent variables with weights and reorganizes the data that helps form cells to design the optimize layout. This procedure is used to reduce the number of bottlenecks in regrouping the departments to improve the productivity and eliminate the cross-line flow. By using Rank Order Clustering Algorithm, the Component Group Analysis based on production flow analysis can be found.
Analyze Phase
Analyze phase presupposes the use of Systematic Layout Planning (SLP) tool which includes flow of materials, activity relationship chart, activity relationship diagram, space requirements for departments, workstations and storage area as well as space available. At this stage, layout alternatives will be developed by using AutoCAD Program.
Improve Phase
In improve phase Multiple Criteria Decision Making (MCDM) will be used to evaluate the layout alternatives. This tool uses matrix with different criteria displayed, each criterion is assigned with weights based on importance. These criteria will be economical and non-economical to cover all characteristics of the decision. Finally, it ends up with performance scores for each alternative with ranked number, and the number one being the best alternative choice which satisfies the majority of the criteria.
Control Phase
Since the project period is limited a simulation of the current layout and improved layout will be done to evaluate the implications. The simulation will include drafting the layouts and then reproducing them at a smaller scale using digital tools.
Plan of the Study
This research will be conduct according to the proposed flow chart (Figure 1) below.
Implementation
This section will show the method used in order to approach the problem and meet the objectives of the research plan.
Define Phase
This phase begins by identifying the data that needs to be processed to solve the problem, these data are divided into three stages which are: interviews and surveys, value stream mapping and observation of current office layout.
Interviews and Surveys
Interviews and surveys with managers and employees are used to determine what improvements the company visualization in the new layout, it holds questions about the current layout such as employee movement, ease of transportation, ease of communication with team members, space for workstations, space for files and documents. Also, it poses questions about the improvements needed to give us a general knowledge of what mangers and employee are facing of problems in their day to day activities due to a poorly designed office layout. The below questions are used in the survey and interviews:
- What is your gender?
- What is your current position within the organization?
- How many years of experience do you have in the current organization?
- Is there enough space between the employee?
- Is the office spacious?
- Is there overcrowding in the office?
- Is there enough space for workstations?
- Is there enough space for files and storage documents?
- Are there any difficulties in communicating with team member?
- Are there any difficulties in communicating with other departments?
- Are you satisfied with current office layout?
- Does the office layout need improvements?
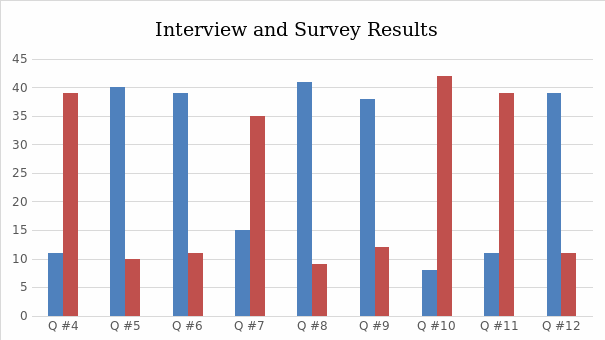
The interviews and surveys were conducted on 50 employees in the company including managers and head of departments. The results were illustrated by Bar chart as seen in the following figure (Figure 2). From the chart results, around 78% agree that the office layout needs improvements.
Value Stream Mapping
A value stream mapping is highly important to display all critical steps in the process and identify production waste by quantifying the time at each step. In facts, the administrative departments in the company provides many different services to serve the community, but the focus will be on the projects outcome because it is the most important processes and it contains a lot of details steps. Besides, it combines different administrative departments to finalize the service or outcome. So, it will be helpful to investigate the problem or gap easily.
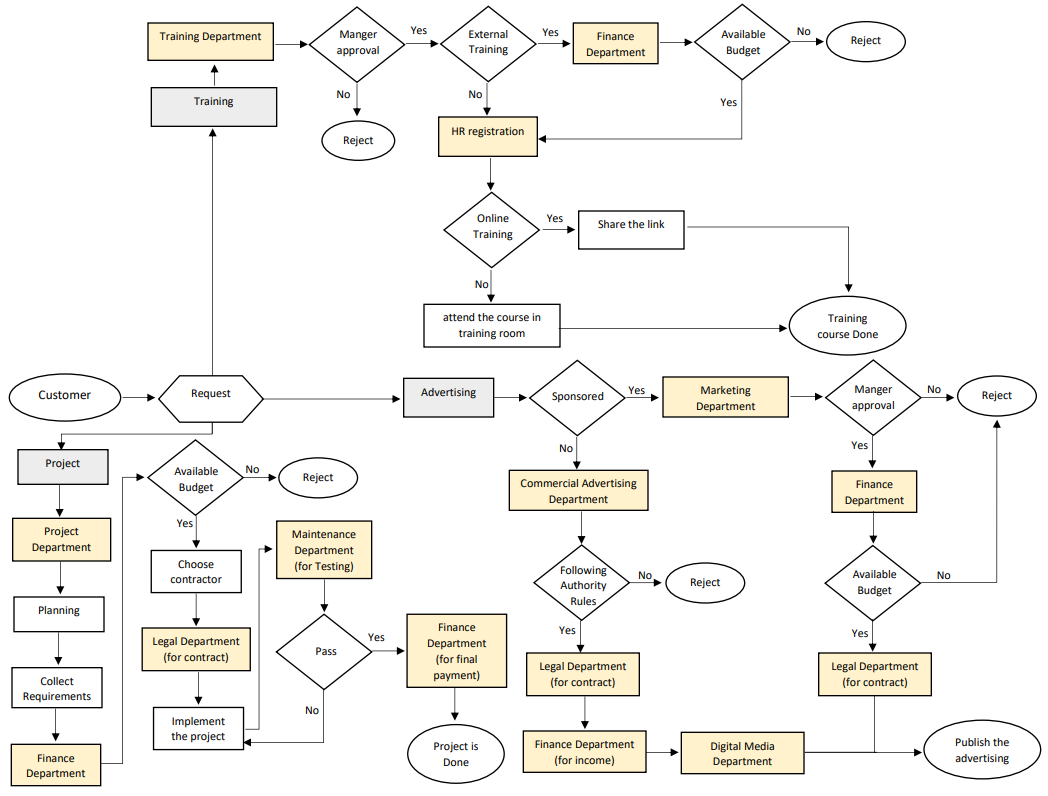
The following figure (Figure 3) shows the value stream mapping for projects, where each project has a time frame and life cycle. It starts with a request or initiative coming from the community and management. The request goes through many different processes until the project is delivered. First, it goes through studies to obtain approval from higher management. After that planning and collecting requirement steps will come forward, where the project department will study, measure and schedule the data to meet the project objectives. All the outcomes of the previous steps will be handed over to finance department specially the procurement section. They will generate a bill of quantity (BOQ), prepare the tender documents and float it to the bidders. The winning bidder will be chosen based on different criteria. After that the legal department take place to create a contract that define the obligations of each contracted party. After completing all the above mentioned requirement of administrative departments, the implementation of the project will start by external company according to the agreed standards, and the payment is delivered to contractor as per work progress. Testing, operating and warranty of the project will not be included in the value stream mapping, because it’s out of the scope of the administrative departments tasks.
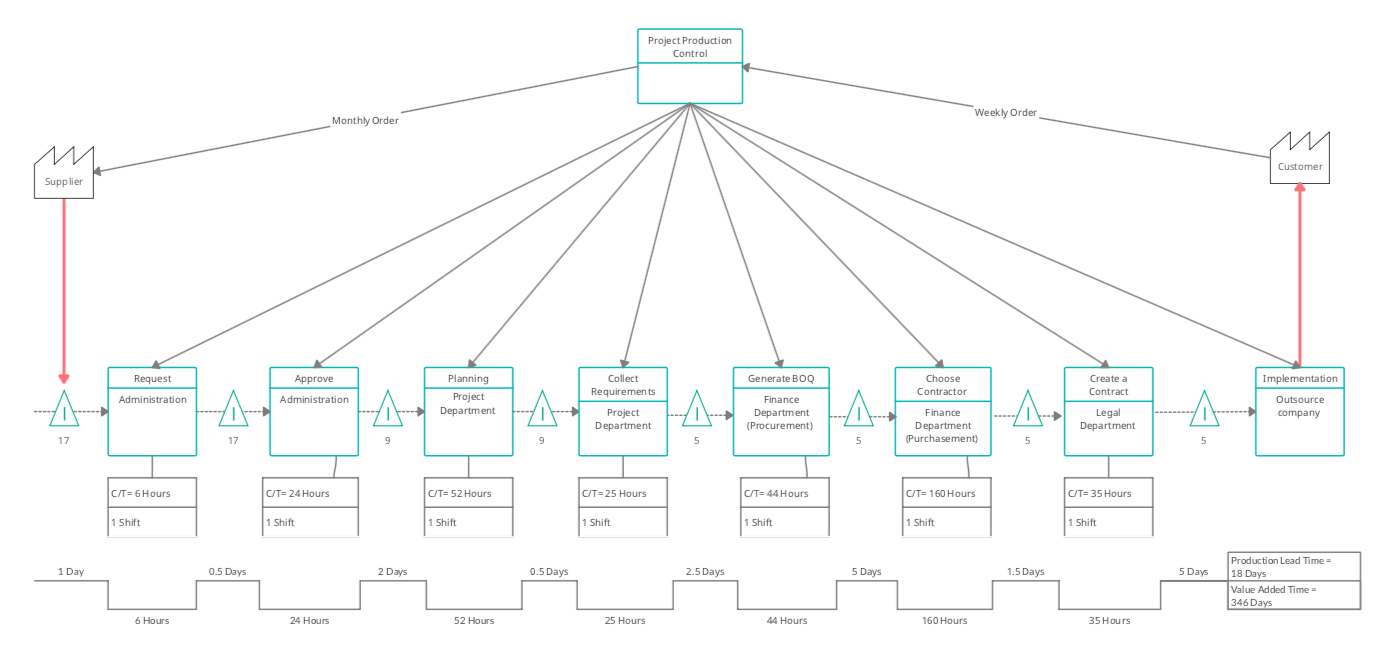
So, after studying and understanding the value stream mapping and following the project aim of increasing productivity and eliminating time that do not add value, it can be concluded that the production lead time is considered long and the company wants to reduce it to the lowest level. Moreover, it can be noted that most of the wasted time in the finance department specially because of the excessive personnel movement, when employees have to move between departments to solve tasks; unnecessary transportation of documents and facilities from one department to another or from one section to another in same department; time delays due to inadequate office layout, and overproduction (Madhani, 2022). For this reason, the current office layout will be studied next because it is the main cause leading to long production and time wasting.
Observation of Current Office Layout
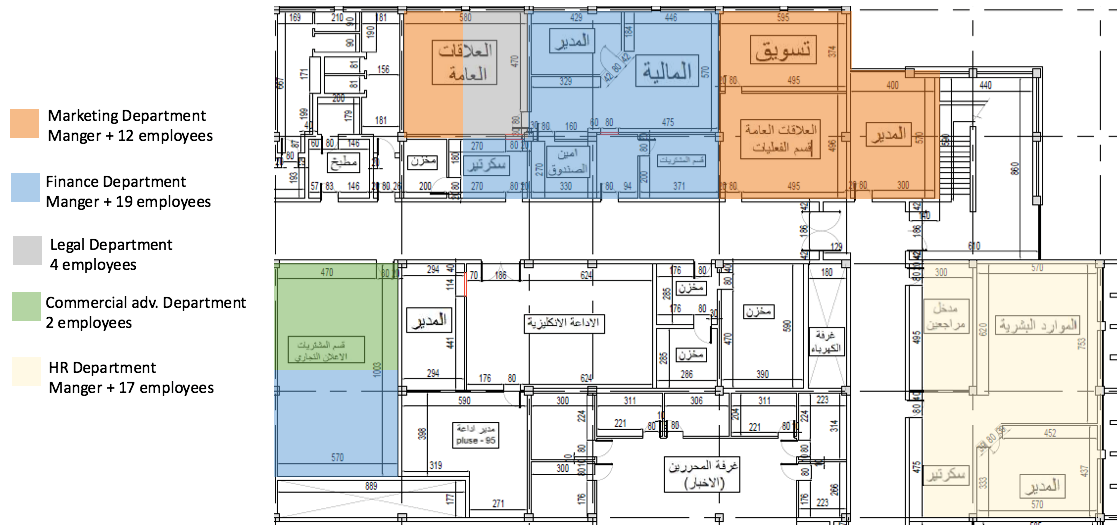
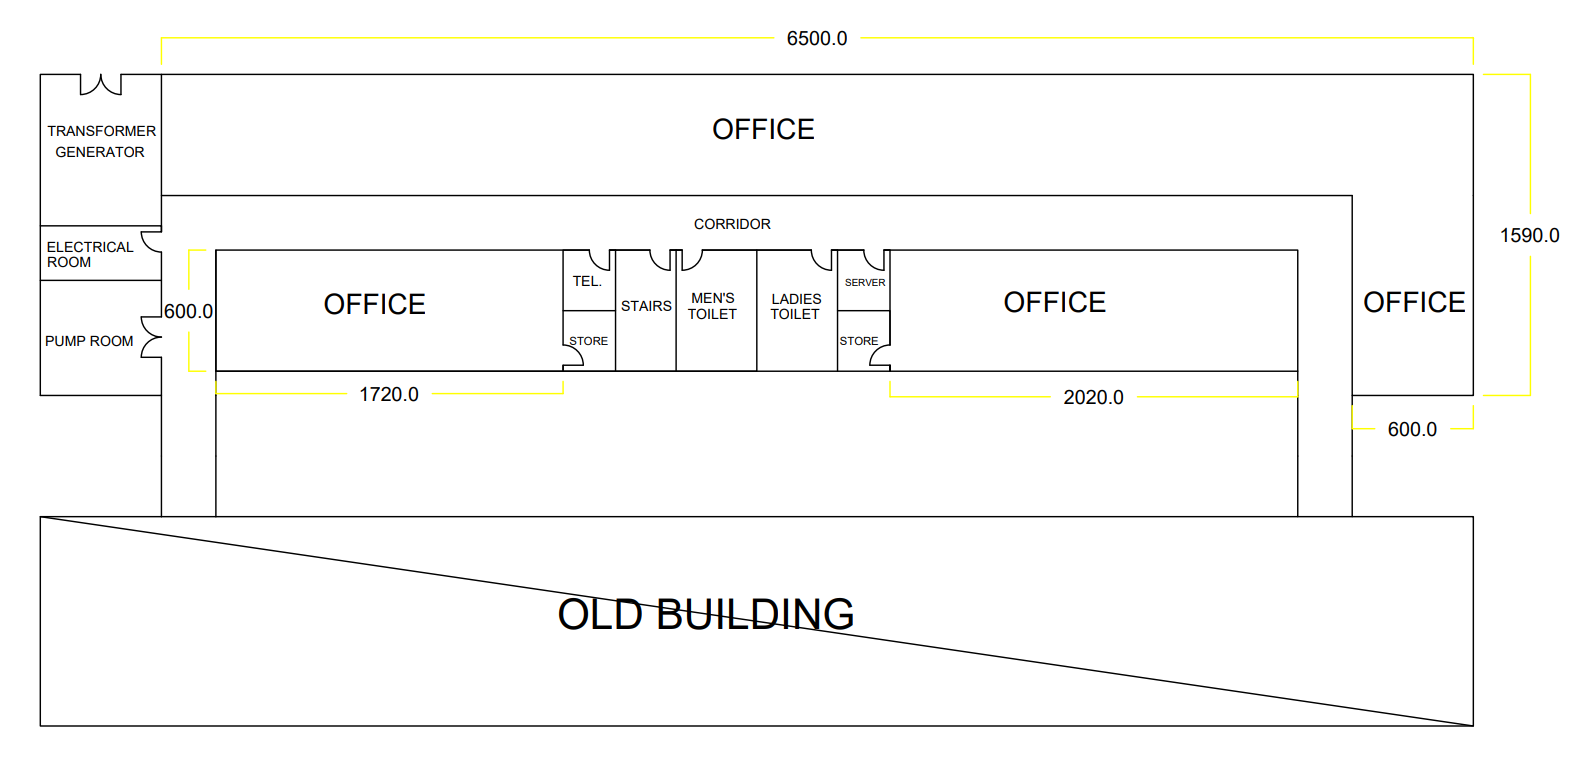
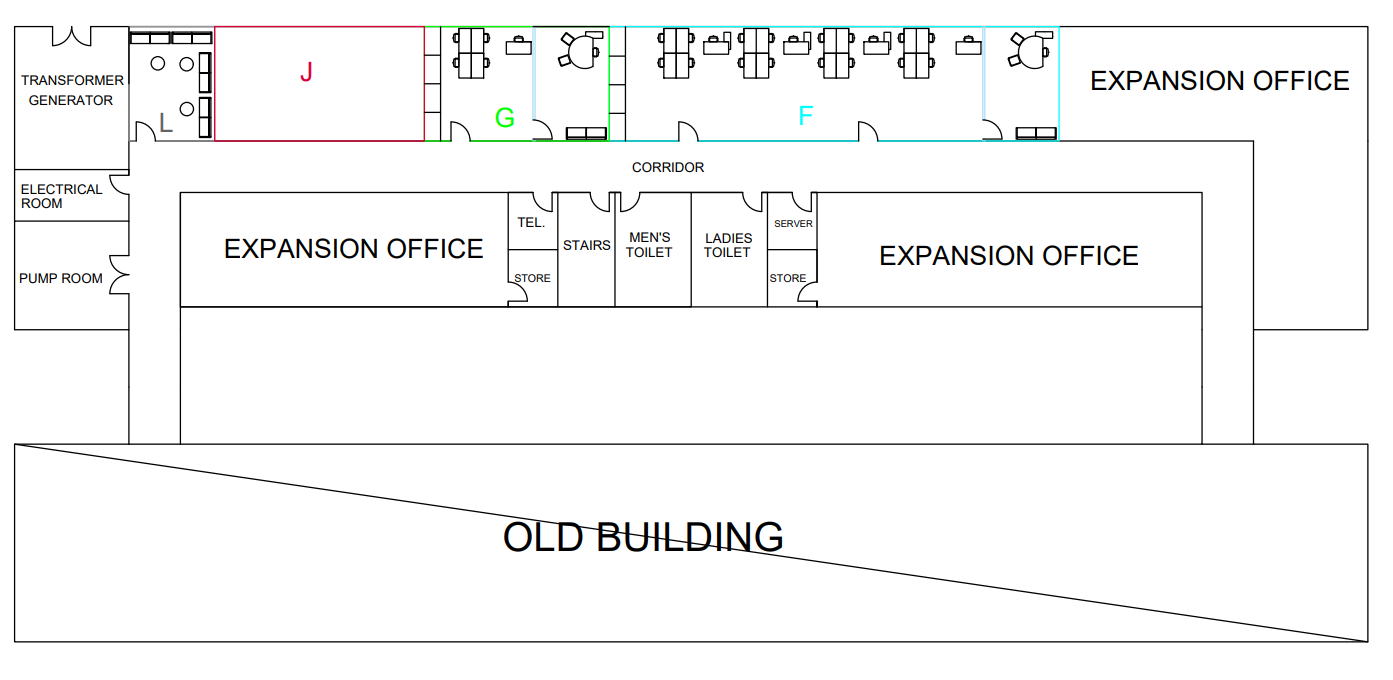
This step will also help to understand the workflow between departments and the problems faced by employees. But due to legal reasons, it is not possible to display the full layout of current building. The following figure (Figure 4) shows the snapshot of the current layout (old building) to provide a broader understanding of the problem. It shows some of administrative departments, but the focus will be placed on financial department to study the reason for having long production lead time.
As the company growing and the number of employees increasing several departments are divided into two different locations due to the absence of space for all employees in one area. One of these departments is Finance Department (in blue colour) as shown in the figure below (Figure 4). This situation leads to miscommunication and misunderstanding between the workers and increase the unnecessary transportation between the sections or other departments, also it affects the employee performance. The development of an optimal office layout will reduce these lean wastes by improving the productivity of workforce.
Measure Phase
This phase is about measuring the relevant data for the problem and determine the parameters that need to be quantified.
Process Flow Chart
Process Flow Chart is representing the separate steps to perform a process in sequential order, where each step of the process is illustrated in a symbol linked together by connecting arrows or lines. This will help determining the steps that add value to simplify the work for operators and workers to follow the processes. In this case, the process flow chart is used for all administrative services provided in the company to understand the processes that are followed by the employees for each department or section, also it will help in planning the new office layout. The Following figure (Figure 5) shows the process flow chart for three services which are: training, advertising and projects.
Rank Order Clustering (ROC)
ROC is a technique that use independent variables with weights and reorganizes the data that helps form cells to design the optimal layout. This procedure is used to reduce the number of bottlenecks in regrouping the departments to improve the productivity and eliminate the cross-line flow. By using Rank Order Clustering Algorithm, the department component group analysis can be found based on process flow analysis.
Table 1: ROC matrix 22 21 20
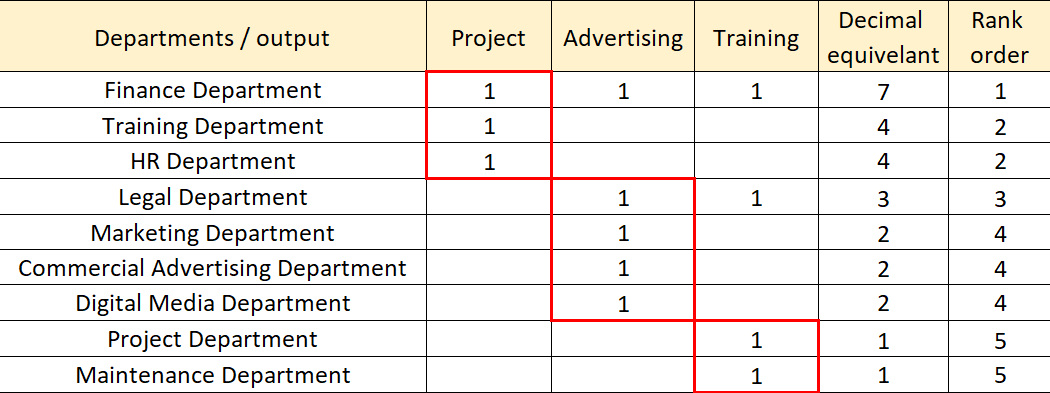
The matrix in (Table 1) illustrates that there are 3 cells, these cells are combined different departments that include (Cell 1: Finance, Training and HR Departments, Cell 2: Legal, Marketing, commercial Advertising and Digital Media Departments, Cell 3: Engineering and Maintenance Departments). This result of the matrix is showed that each output goes through the different departments when processing.
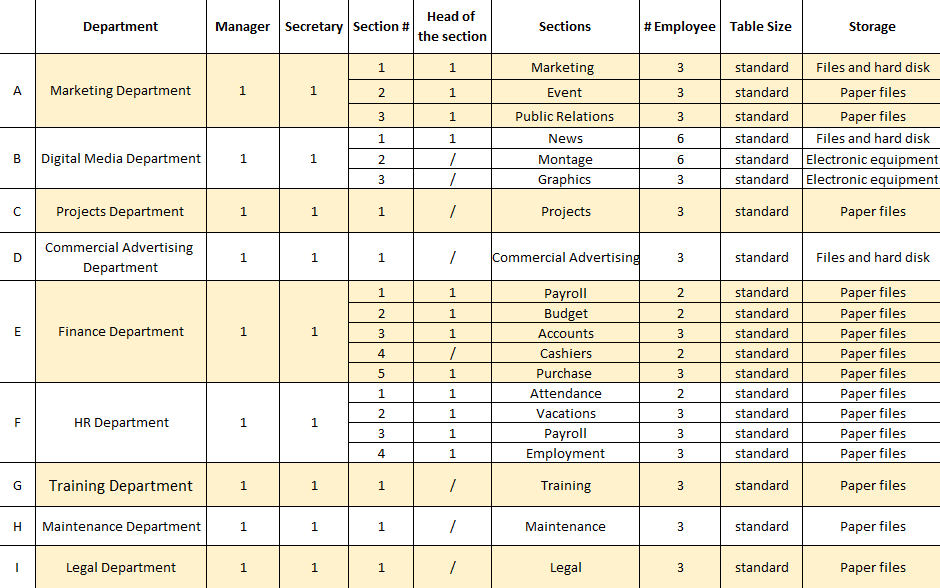
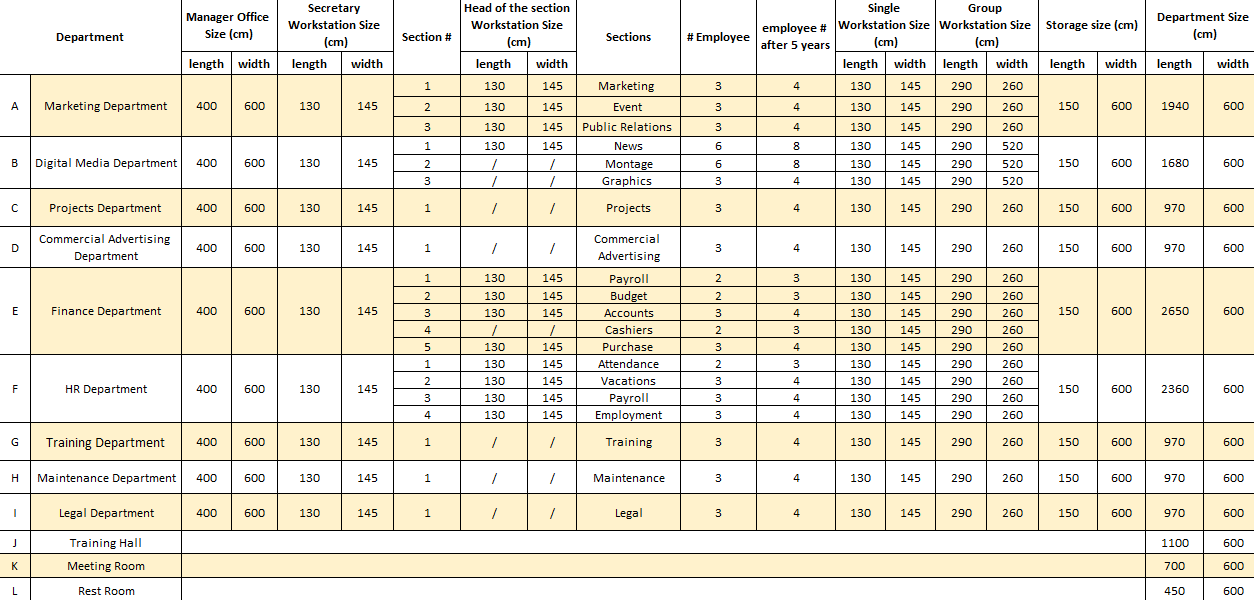
Departments Requirements
The last step in the measuring phase that determines the departments’ requirements such as the number of employees in each department as well as the key prerequisites of forming an optimal layout. These data include the number of departments, the number of sections in each department, the number of employees in each section, the number of secretaries for each manager, and types of storage for each department. The following table (Table 2) summarized all requirements data.
Table 2: Departments requirements
Analyze Phase
After the measure phase, analyzing the problem will start by using facilities planning tools which is Systematic Layout Planning (SLP) tool to get the layout alternatives.
Activity Relationship Chart
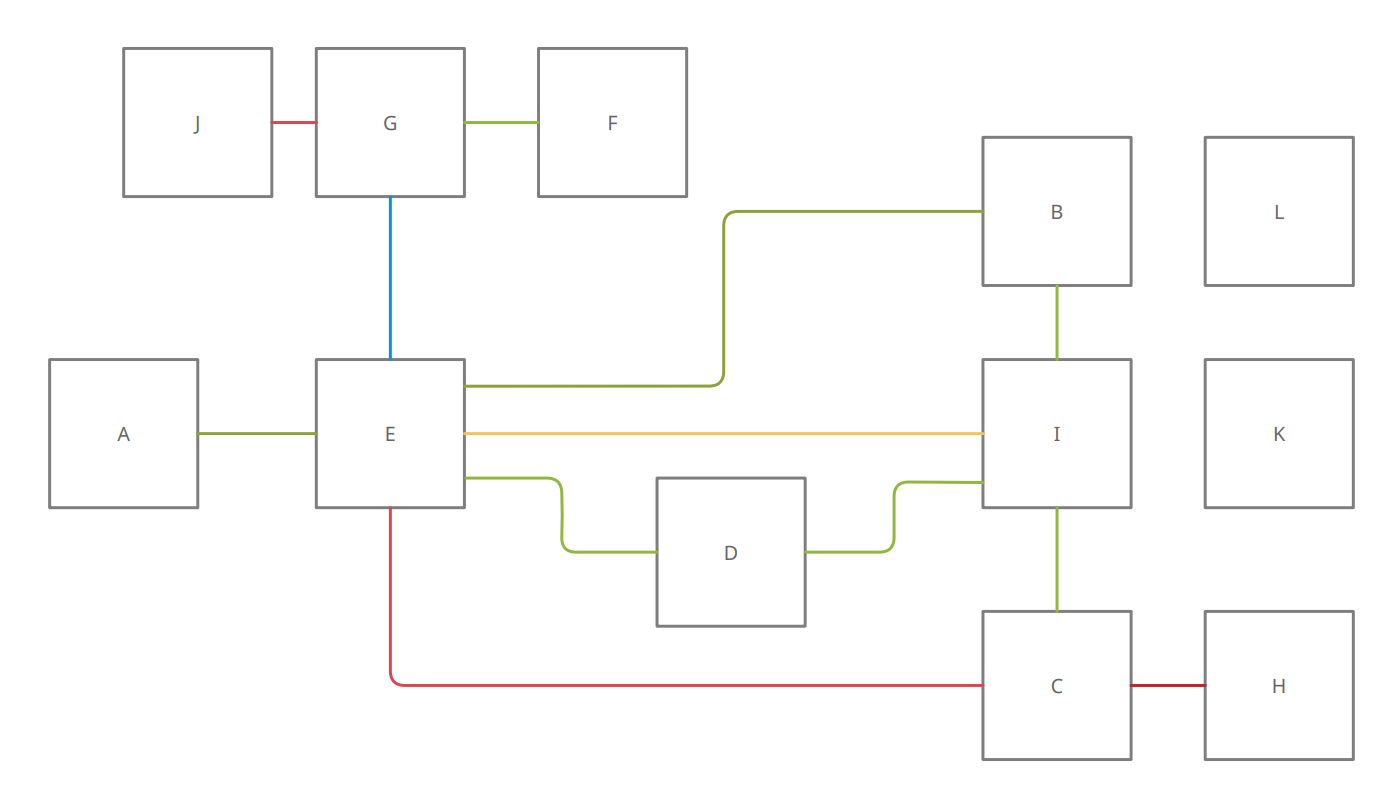
Activity relationship chart is a technique used to display the level of relationship or linkage between each department (Apple, 1990). It consists of a table that contains several letter symbols to show the closeness relationship between the administrative departments, and each letter has a meaning as shown below. The following figure (Figure 6) shows the activity relationship chart.
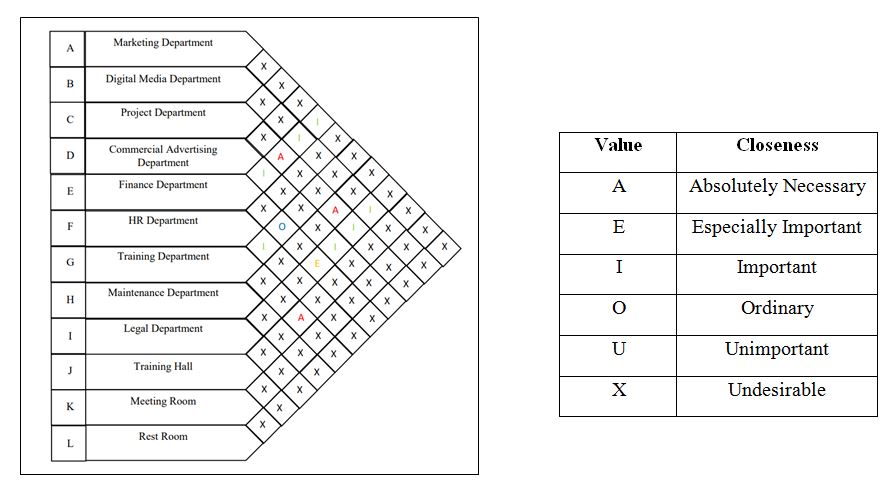
Activity Relationship Diagram
Activity relationship diagram is based on activity relationship chart (ARC). It is the basis for planning and creating alternative layouts. The following figure (Figure 7) shows the activity relationship diagram.
Space Details
The following step is space analysis which focuses on the necessary requirements to determine the space for workstations and departments.
Available space
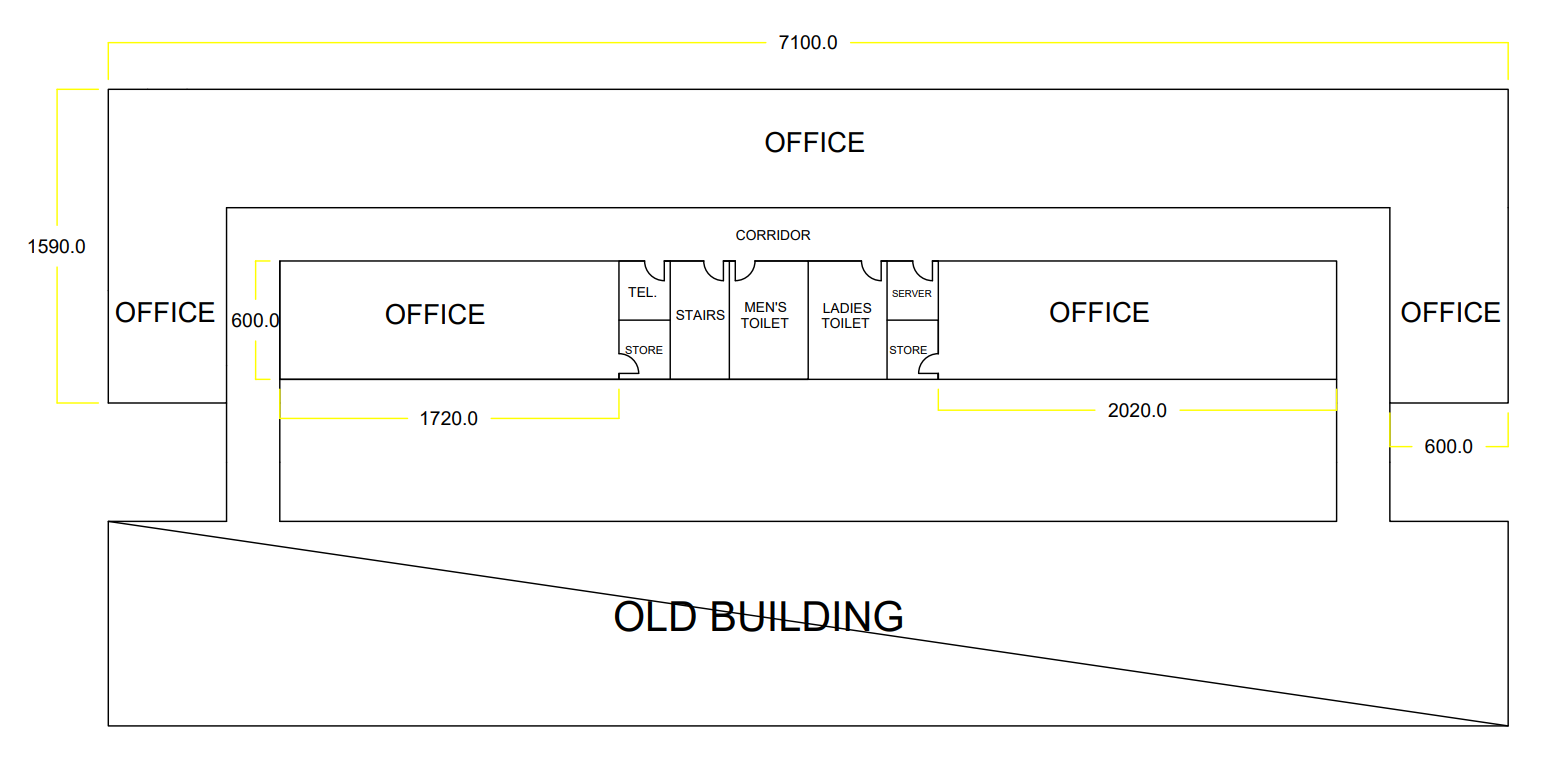
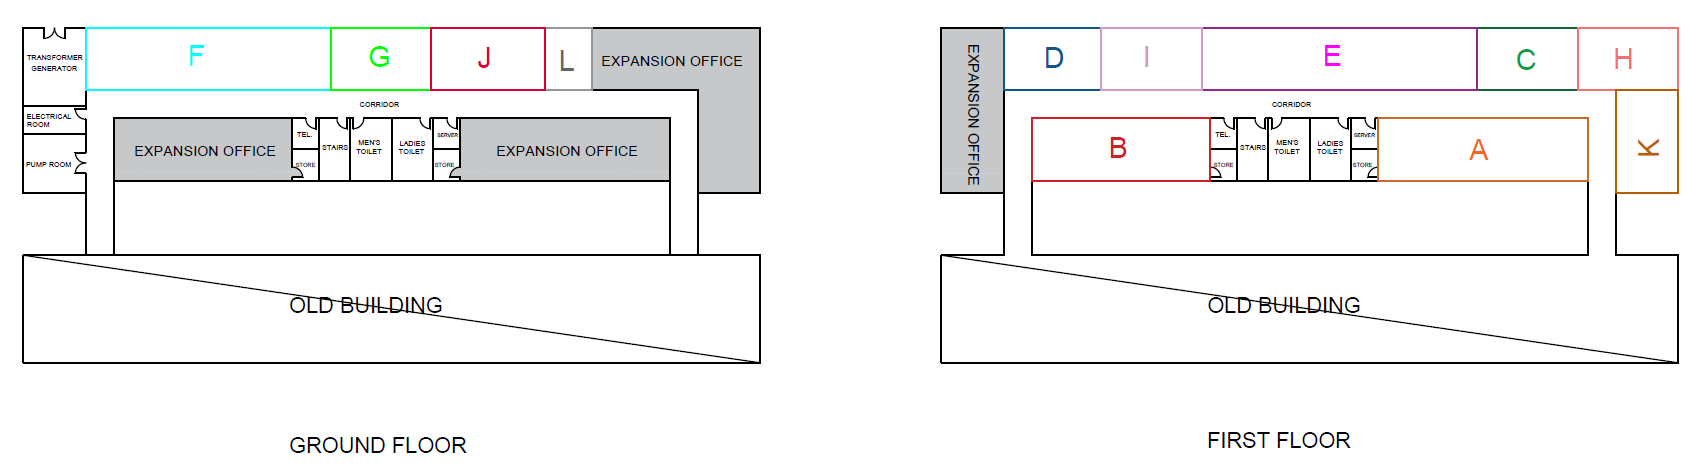
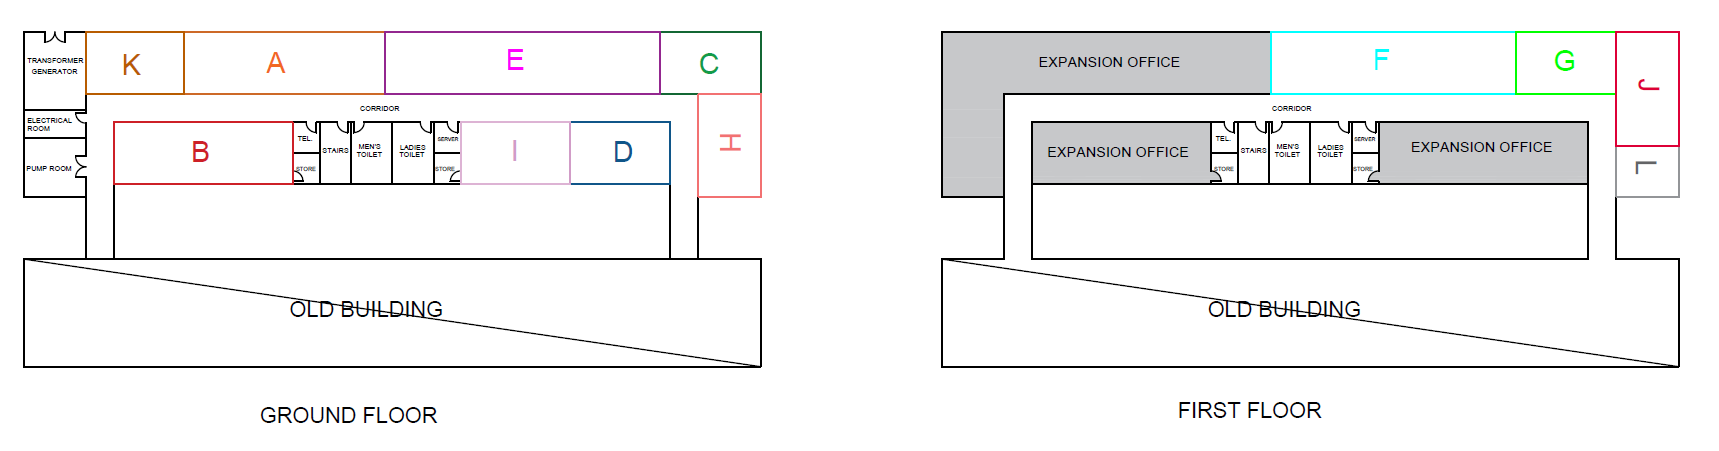
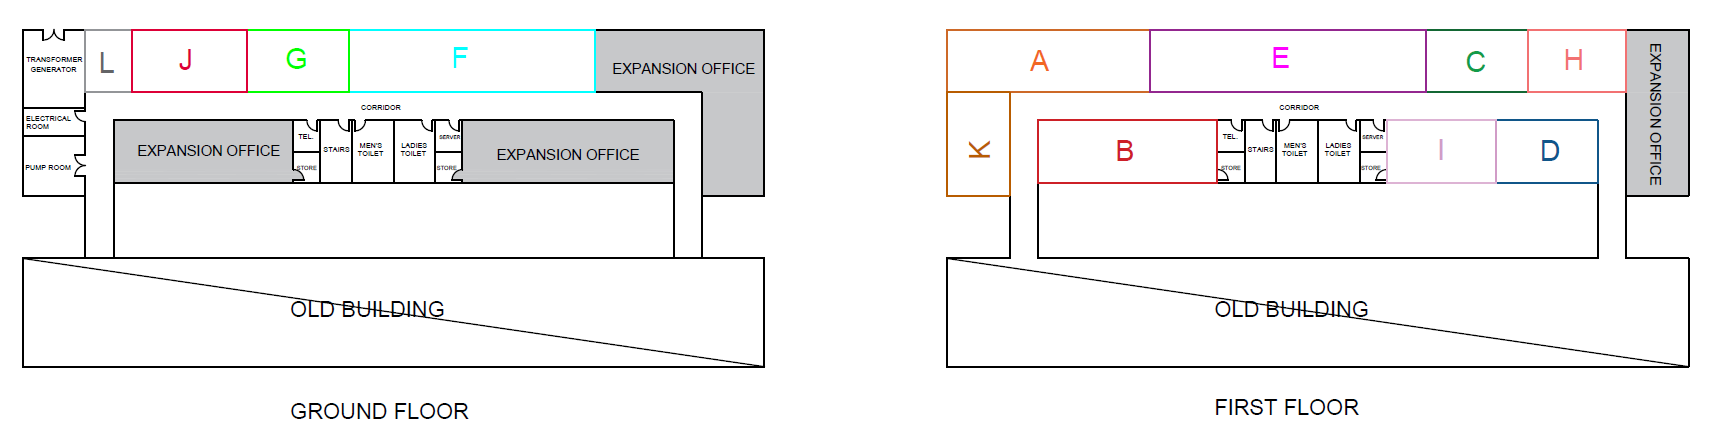
The company commissions building a new extension to shift administrative departments, and wants it designed based on the departments’ needs to provide more comfortable workplace for employees which will enhance the effectiveness and productivity of their work. The following drawing shows the initial layout with approved measurements to distribute the departments based on the relationship chat. The following drawing (Figure 8) shows the ground and (Figure 9) shows the first floor of extension building (All dimensions are in cm). The total available area in ground floor is equal to 6738000 cm2 and the total available area in first floor is equal to 7692000 cm2 .
Workstation size
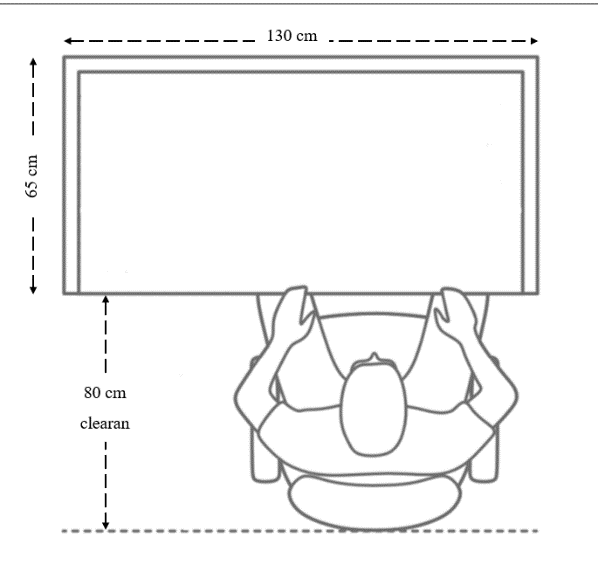
A workstation is an area where work is completed. It designed to provide a working area for employees including computers and other necessary equipment. The organization may have several workstations for different purposes, but in this paper, the focus is in administrative departments where all workstations are similar. So, determining the required space for each workstation in the organization will help in identifying the required total area for each department. The following drawing figure (Figure 10) shows the detailed size of workstation.
Department Area Requirements
The goal of this step is to determine the required area for each department to improve the facility area efficiency, increase productivity, facilitate employee movements, and reduce the floor space cost. Once the space requirements for the individual workstation had been determined in previous step, the department space or area requirements can be established based on the company needs. The following table (Table 3) illustrates the areas requirements for each department. It consists of 9 administrative departments and 3 service rooms which are meeting room, training hall, and rest room. As shown in the above layout in (available space section) the width of all departments is fixed and equal to 600 cm. So, to find the total area required for each department, the length must be determined based on the size of manger office, head of sections and employee’s workstation (table size + clear space for movement), and storage. In addition, this excel sheet shows estimated number of employees after 5 years which is an increase of 25%, because the company is growing rapidly and the number of employees is increasing in constant rate. Therefore, change should be anticipated and future expansion considered before construction.
Layout Alternatives
The last step of SLP procedure is generating the block layouts alternatives after obtaining the available space and requirements areas. The following figures (Figure 11, 12, 13) shows 3 different alternative layouts.
Improve Phase
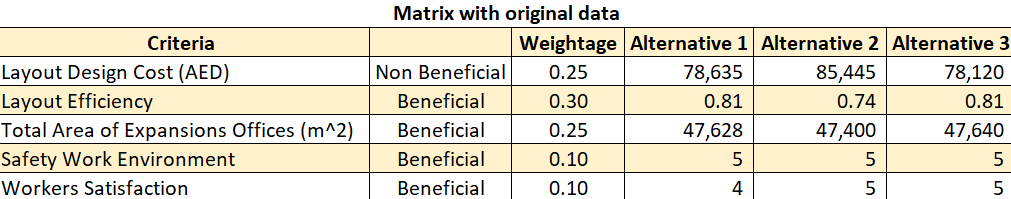
In improve phase Multiple Criteria Decision Making (MCDM) will be used to evaluate the layout alternatives and select the best layout based on different criteria (economical and non-economical), each criterion is assigned with weights based on importance. The following are the criteria that will be used in the (MCDM) matrix.
Layout Design Cost
Calculating the cost of future projects is an important step for the success of any organization, it gives a clear vision for planning the budget because the organization seeks the optimum balance between cost, quality and time. The total cost of office layout is affected by departments location and material flow distances, so if proper layout designs are not adopted, the material flow distance become higher and in return the total cost and time will increase. In this paper, there are no specific limits for the budget, and the layout design cost is calculating based on the following equation:
Activity relationship diagram that presented earlier in (Figure 7) will be used to describe the flow between the departments. Due to unavailability of exact number of material flow between the departments, ![]() will be considered based on score and equal to (5) if the relationship is A, (4) if the relationship is E, (3) if the relationship is I, (2) if the relationship is O, (1) if the relationship is U, and (zero) if the relationship is X. For the transfer cost,
will be considered based on score and equal to (5) if the relationship is A, (4) if the relationship is E, (3) if the relationship is I, (2) if the relationship is O, (1) if the relationship is U, and (zero) if the relationship is X. For the transfer cost, ![]() will equal to 1 AED per meter for all i and j. Furthermore, the distance
will equal to 1 AED per meter for all i and j. Furthermore, the distance ![]() from one department to another is measured between the centroids since all the department in rectangular shape. The following tables (Table 4) shows distance, transfer cost, flow and total cost for layout alternatives.
from one department to another is measured between the centroids since all the department in rectangular shape. The following tables (Table 4) shows distance, transfer cost, flow and total cost for layout alternatives.
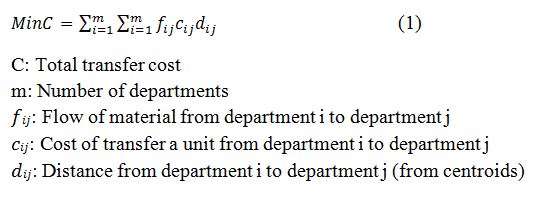
Table 4. Cost analysis for 3 layout alternatives
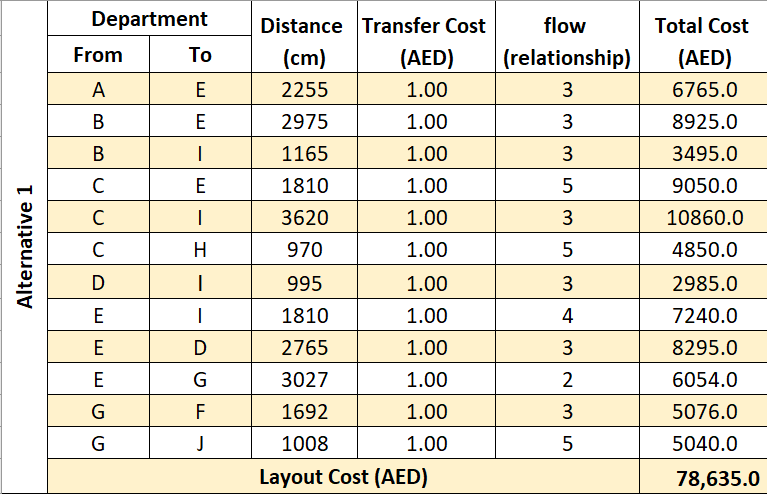
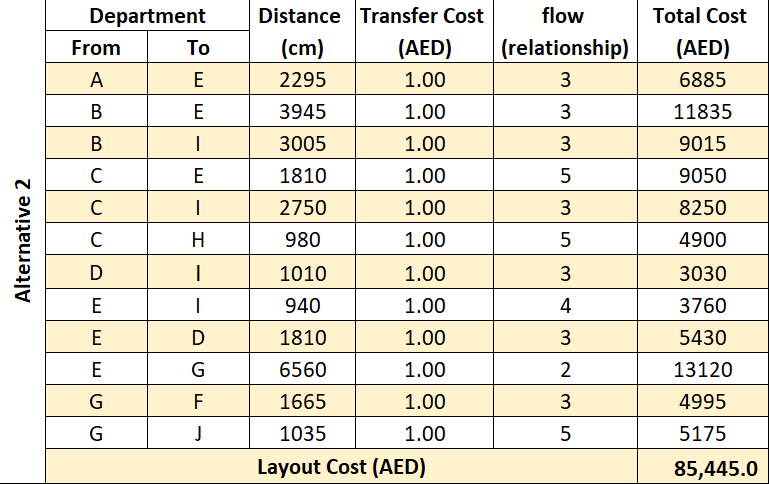
The total cost for each flow is calculated by multiplied the distance by the transfer cost and the flow, then summed up the total costs to find the layout cost for the 3 layout alternatives. Based on these results, the third alternative is better than the other alternatives because it has the lowest cost and that means it has the best arrangement between the departments.
Layout Efficiency
An efficient office layout can facilitate an increased flow of work and information which will lead to increase in employee productivity. The layout efficiency will be accomplished by calculating the adjacency score and flow score (as using in layout design cost) between each department for each alternative using the following equation
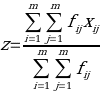
fij: material flow between department i and j (using score rate)
xij: adjacency score, letting xij =1 if departments i and j are adjacent (share a border)
Table 5. Efficiency rating for 3 layout alternatives
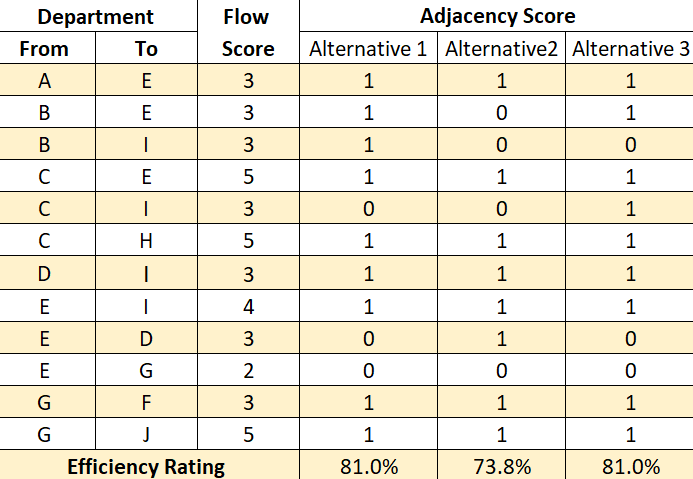
The above table (Table 5) shows the efficiency rating for each alternative after inputting the required data into the formula. alternative 1 and 3 holds the highest efficiency rating by 81% efficiency.
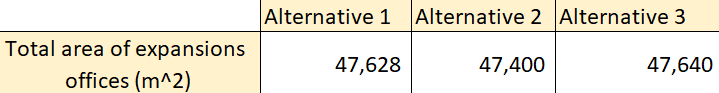
Total Area of Expansions Offices
The company is growing economically so the future expansion of new production (service) line must be taken into consideration before constructing the administrative building. This type of expansion depends on available space for new departments and service line. After creating different alternatives based on relationship chart and diagram, empty areas have been found and can be used for future expansion. The larger total area of expansion indicates that the departments are well organized and the spaces are not wasted. The following table (Table 6) shows total area of expansion for each alternative, alternative 3 has larger expansion area.
Table 6. Total area of expansion offices
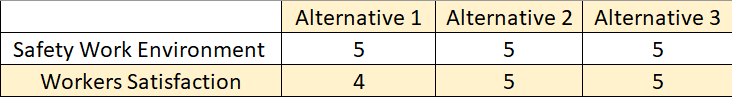
Safety Work Environment and Workers Satisfaction
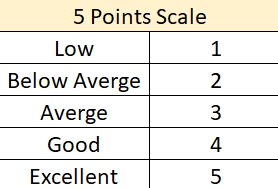
These criteria are based on non-economic aspects, the assessments for these criterions are based on direct observation and recommendations from the managers and employee. the following table (Table 7) shows the values based on 5 points scale. It has been found out that alternative 2 and alternative 3 have the highest safety work environment and workers’ satisfaction. Alternative one, though got 5 points from the perspective of safety work environment, got only four points in terms of worker satisfaction.
Table 7. Safety work environments and workers satisfaction
Multiple-criteria decision making (MCDM) Matrixes
After explaining each criterion, (MCDM) matrix assembled with its criteria and weights as seen in the following table (Table 8).
Table 8. (MCDM) original data
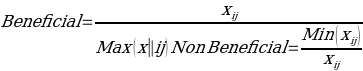
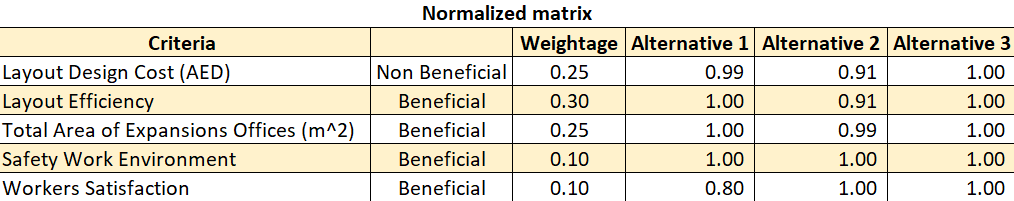
Then normalize the matrix by using below equations for beneficial and non-beneficial criterion. The beneficial criteria are calculated by taking the value of each criterion and dividing it with the maximum rate between the alternatives, and the non- beneficial criteria is done by taking the value of the lowest rate in the alternatives and divide it with rate of each alternative. The normalization result is shown in the below table (Table 9).
 (3)
(3)
where xij is the rate for each alternative.
Table 9. (MCDM) normalized matrix
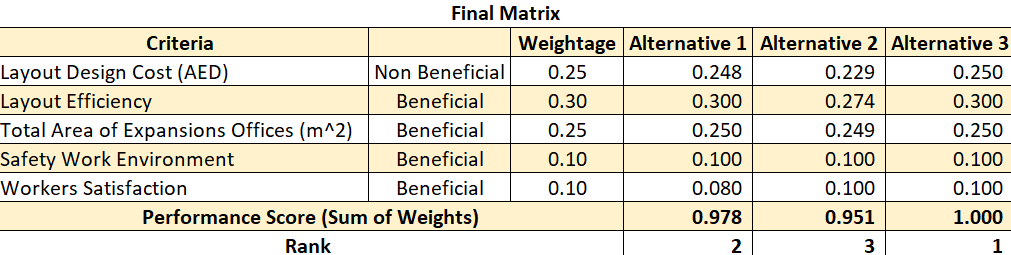
After getting the normalized matrix, the final matrix will be calculating by multiplying each criterion rates with their assigned weights, then summed up the result for each alternative to get the final performance score for each alternative. Based on the score, the values are ranked as shown in the below table (Table 10).
Table 10. (MCDM) final matrix
MCDM Results
This section describes the main results obtained to develop an office layout that increases the employee productivity and reduces the potential lean. Three alternatives were developed with taking into consideration the flow and relationship diagram. The layouts alternatives already have better results compared to the current layout, and based on the (MCDM) analysis alternative 3 which is shown in (Figure 13) has the best design because it has highest performance score, hence ranked as number 1. Moreover, it achieves the desired objectives which are minimizing total cost, and maximizing the layout efficiency and safety.
Control Phase
Since the project period is limited, a simulation of the chosen layout (alternative 3) will be done to evaluate the implications. Creating a visual representation of a building is a valuable way to minimize the risk with a high degree of accuracy to meet the departments requirements and ensure smooth implementation before construction. The following figures (Figure 14 and 15) represent the ground and first floor layout after the furniture and other necessary requirements distributed according to the departments needs as shown in the previous table (Table 3).
Results and Discussion
In the define phrase, interviews and surveys were taken to determine the problems employees face at work determined by inadequate office layout. The results of the interviews showed that around 78% of employees agree that the office layout needs improvements. Applying value stream mapping allowed to pinpoint the problems the company faced. These comprised a long production lead time and excessive personnel movement as well as unnecessary transportation of documents between sections and departments. Moreover, value stream mapping showed that most of the listed above problems were concentrated in the financial department. Therefore, the financial department layout was studied to determine the reasons for a long lead time.
It turned out that the reason for high lean waste and low productivity of the financial department lay in the fact that it was divided into two different locations because the office layout did not let to seat all employees in one room (Figure 4). Process Flow Chart and Rank Order Clustering were used to determine the working processes responsible for high lean waste and delays (Figure 5, Figure 6). It turned out that the low productivity was determined by the fact that the output of each department went different departments when processing.
The project aimed to resolve the above-mentioned problems by developing an optimal office layout. To determine the optimal number of employees, departments’ requirements map was drafted (Table 2). Based on this number, department area requirements were outlined (Table 3). It was found that the width of all departments was fixed and equaled 600 cm while the length was determined based on the size of manger office, head of sections and employee’s workstations. Based on these requirements, three optimal office layouts were developed. Costs showed that layout 3 was the least costly while layout 2 was the most expensive one. Layout 1 was just a little more expensive than layout 3 and ranked second (Table 4). Layout efficiency analysis showed that layouts 1 and 3 had the highest efficiency rating (Table 5). The total area of expansion showed that alternative 3 had larger expansion area, while alternative 1 was smaller than 3 by only 12 m (Table 6). In terms of safety work environment and workers satisfaction, variants 2 and 3 got the highest scores. Multiple-criteria decision making (MCDM) Matrixes were used to assess the overall effectiveness of all three layouts. It has been found out that alternative 3 shown in (Figure 13) has the best design and the highest performance score.
Discussion
The results of the project allowed to answer all reseach questions the project aimed to cover. Thus, it has been found that the factors that most of all affect employee productivity are lean wastes, excessive personnel movement and unnecessary transportation of documents across sections and departments. The best practices for office layout have been identified that, apart from lean six sigma, include value stream mapping, process flow chart, rank order clustering, and multiple-criteria decision making. The current working environment was assessed in terms of workers’ productivity and safety. It has been found that long lead time seriously impacts workers’ productivity. Using the above-listed methods, improved facility layout was designed that satisfies the current needs and future demands of the company. The new office layout office layout will help to increase the employee productivity and reduce the potential lean wastes.
The findings agree with what other researchers found, namely that lean wastes impact employees’ productivity and that lean six sigma methodology allows to develop layouts that help to reduce excessive personnel movement and increase personnel satisfaction and output. However, while in earlier studies Lean Six Sigma was applied to improve industrial layouts, the novelty of this project lies in the fact that the method was successfully applied for improving office buildings. Due to such successful implementation, the new understanding was developed. It shows that Lean Six Sigma may be successfully used for office and commercial buildings improvement as well. Moreover, it has been found that the combination of Lean Six Sigma method with value stream mapping gives better results than those that were received applying only Lean Six Sigma as shown in the literature.
Recommendations
This project comprises a comprehensive study of literature and assessment of methods used to develop office layouts. The proposed methodology comprises using six sigma DMAIC methodology with engineering tools for developing an improved layout. The results showed that Lean Six Sigma may be successfully used for improving layouts of office buildings and the best output is achieved when this method is combined with other engineering tools. The improved layout serves to significantly reduce lean wastes and increase employees’ productivity. The research outcome may be successfully used by engineers working in the field of office improvement. The research is recommended for all those who are interested in improving office designs. The project served to elaborate an office layout that increases the employee productivity and reduces potential lean wastes. The results of the work are limited by the methods used, therefore there are ample opportunities for further researchers to apply other combinations of engineering tools to see whether they are more effective for improving office designs.
Reference List
- Abualsaud, A. S., Alhosani, A. A., Mohamad, A. Y., Al Eid, F. N., & Alsyouf, I. (2019). Using six sigma DMAIC methodology to develop a facility layout for a new production line. In 2019 8th International Conference on Modeling Simulation and Applied Optimization (ICMSAO), 1-5, IEEE.
- Ali Naqvi, S. A., Fahad, M., Atir, M., Zubair, M., & Shehzad, M. M. (2016). Productivity improvement of a manufacturing facility using systematic layout planning. Cogent Engineering, 3(1), 1207296. Web.
- Andrade, J. B., & Bragança, L. (2019). Assessing buildings’ adaptability at early design stages. In IOP Conference Series: Earth and Environmental Science, 225 (1). IOP Publishing. Web.
- Apple, J. M. (1990) Tata Letak Pabrik Dan Pemindahan Bahan. Bandung: ITB Bandung.
- Beno, M. (2021). Office evolution from ancient age to digital age (E-working). In World Conference on Information Systems and Technologies (pp. 182-192). Springer, Cham. Web.
- Gnedina, L. Y., Dolgusheva, V. V., & Danko, V. V. (2019). Transformable structures. In IOP Conference Series: Materials Science and Engineering, 687 (3). IOP Publishing. Web.
- Kaufmann-Buhler, J. (2021). Computing the cubicle: Design for the high-tech office, 1970–1990. IEEE Annals of the History of Computing, 43(3), 6-21. Web.
- Lee, S. Y., & Brand, J. L. (2005). Effects of control over office workspace on perceptions of the work environment and work outcomes. Journal of environmental psychology, 25(3), 323-333. Web.
- Liggett, R. S. (2000). Automated facilities layout: past, present and future. Automation in construction, 9(2), 197-215. Web.
- Madhani, P. M. (2022). Lean Six Sigma deployment in HR: Enhancing business performance. International Journal of Human Resources Development and Management, 22(1-2), 75-97. Web.
- Öhrn, M., Wahlström, V., Harder, M. S., Nordin, M., Pettersson-Strömbäck, A., Bodin Danielsson, C.,… & Slunga Järvholm, L. (2021). Productivity, Satisfaction, Work Environment and Health after Relocation to an Activity-Based Flex Office—The Active Office Design Study. International Journal of Environmental Research and Public Health, 18(14), 7640. Web.
- Pimenova, E. V. (2019). The use of transformable systems in the architecture of buildings of educational organizations. In IOP Conference Series: Materials Science and Engineering, 698 (3). IOP Publishing. Web.
- Ramani, P. V., & KSD, L. K. L. (2019). Application of lean in construction using value stream mapping. Engineering, Construction and Architectural Management. Web.
- Reggasa, Y. (2013). Facility Layout Optimization. IUP Journal of Mechanical Engineering, 6(4), 52. Web.
- Rezaei, F., Bulle, C., & Lesage, P. (2019). Integrating building information modeling and life cycle assessment in the early and detailed building design stages. Building and Environment, 153, 158-167. Web.
- Seitz, P. (2019). Where do you cry in an open plan office? A historiography of interior office design. Web.
- Singh, M., & Rathi, R. (2018). A structured review of Lean Six Sigma in various industrial sectors. International Journal of Lean Six Sigma. Web.
- Solomon, T. (2018). Great office design boosts productivity. HR Future, 2018(1), 16-17. Web.
- Wei, X., Yuan, S., & Ye, Y. (2019). Optimizing facility layout planning for reconfigurable manufacturing system based on chaos genetic algorithm. Production & Manufacturing Research, 7(1), 109-124. Web.
- Burroni, L., Bianciardi, C., Romagnolo, C., Cottignoli, C., Palucci, A., Massimo Fringuelli, F., Biscontini, G. and Guercini, J., 2021. Lean approach to improving performance and efficiency in a nuclear medicine department. Clinical and Translational Imaging, 9(2), pp.129-139.