Introduction
The financial analysis of Coca Cola is performed in this section, which focuses on the company’s financial performance and its stock price movements in the last five years. The analysis compares the company’s stock performance with three competitors, which also operate in the global market. Lastly, the analysis shows a break-even analysis based on the company’s financial information for the previous year.
Stock Performance
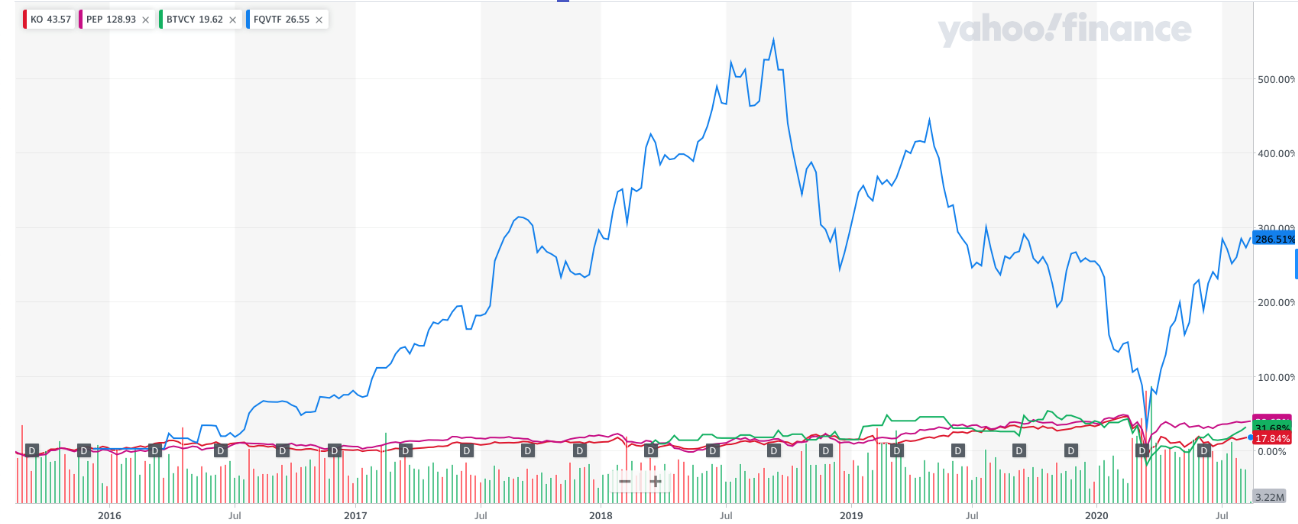
Figure 1 shows stock price movements of Coca Cola’s stocks, KO, along with those of its competitors, including PepsiCo, Fevertree Drinks PLC, and Britvic PLC over the last five years. It is noted that the stock prices of Coca Cola, PepsiCo, and Britvic PLC did not have many variations in the last five years except in 2020 as the coronavirus pandemic occurred. The stock price of Coca Cola increased by 17.89% in the previous five years, whereas that of PepsiCo increased by 39.66% (Yahoo! Finance, 2020). On the other hand, the stock price of Fevertree Drinks PLC increased significantly during 2005 and September 2018 and then declined. Stock prices of all four companies improved after March 2020 (Yahoo! Finance, 2020).
Growth Rate and Earnings
Table 1 indicates the growth rates of different profitability measures and total revenue of Coca Cola in the last five years.
Table 1. Earnings Growth (The Coca Cola Company, 2020; 2018; 2016).
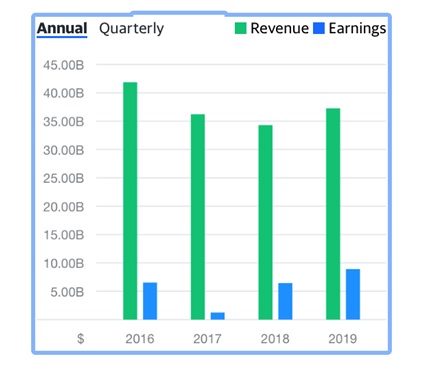
It is noted from Table 1 that the company had weak cost management as its gross profit had a negative growth from 2015 to 2018. It only managed to achieve growth in its gross profit in 2019. Similarly, it is noted that the company’s operating profit and net profit fell in the first three years of analysis. The significant decline in the company’s net profit in 2017 was due to the payment of accrued taxes. It suggests that Coca Cola delayed its tax payments by managing its earnings in the early years.
The sharp increase in its net profit in 2018 was due to its low tax liability in that year. The next two fiscal years, including the current year, would be difficult for Coca Cola as COVID-19 continues to put pressure on consumer markets and companies are forced to roll back their expansion plans. The soft drink and beverages industry, which is already facing a decline due to lower demand for carbonated drinks, would experience a further slowdown in its growth in the next two years. Therefore, negative growth rates could be expected in these years. However, global markets are likely to operate at the previous levels after COVID-19 vaccination becomes available.
The sustainable growth rate of Coca Cola is calculated, and its values are given in Table 2.
Table 2. Sustainable Growth Rate.
Table 2 indicates that the sustainable growth of the company increased until 2017, as the company’s dividend payout ratio increased significantly in those years. However, the growth rate fell in 2018 and 2019 as the company retained more earnings rather than distributing them to its shareholders who were unable to achieve capital gains on their investments in its shares.
Sales Distribution
The annual report of Coca Cola indicates that there are six different operating segments, including Europe, Middle East and Africa, Latin America, North America, Asia Pacific, Global Ventures, and Bottling Investments (The Coca Cola Company, 2020). Table 3 provides values of net operating revenues of the company from its six segments.
Table 3. Segment Revenue.
It is noted from Table 3 that the most significant segment of Coca Cola’s business was North America and then bottling investments. The company’s products include concentrates, syrups, fountain syrups, company trademark beverages, and Coca Cola trademark beverages (The Coca Cola Company, 2020). Table 4 shows that there was a 55:45 split between sales from concentrate operations and finished product operations in 2019.
Table 4. Product Sales.
It is also indicated that the revenue of finished product operations declined in the last five years, whereas that of concentrate operations increased. Table 5 indicates that the company’s sales declined in the US in the last five years. On the other hand, its international sales increased. Furthermore, it is noted that the company’s sales decline from 2015 to 2018 and improved in the last year.
Table 5. Geographical Sales.
Financial Ratio Analysis
The financial ratio analysis conducted in this report calculates and discusses the values of key financial ratios under different categories.
Liquidity Ratios
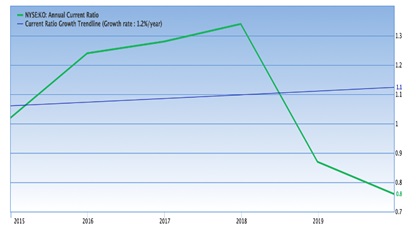
The current ratio value of Coca Cola decline in the last five years as shown in Figure 3, and it was less than 1 in 2019, which implies that it had a weak liquidity position.
Table 6. Liquidity Ratios.
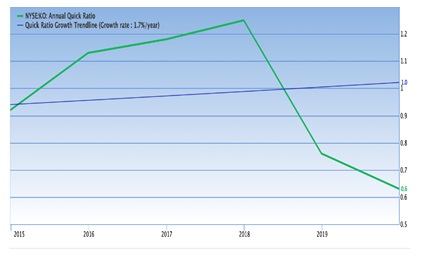
Similarly, the quick ratio of Coca Cola also had a declining trend in the last five years as shown in Figure 4. This situation could force the company to acquire additional loans for managing its operations.
Efficiency Ratio
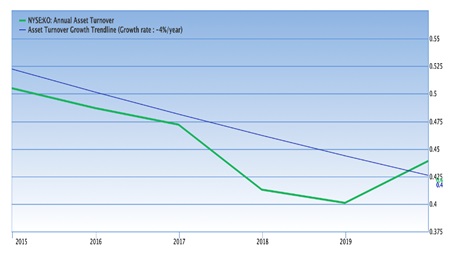
Table 7 indicates that the asset turnover of the company increased in the last five years, which is also depicted in Figure 5, as the company sold off its high cost and low profit-generating units in Europe. A higher ratio value implies that the company generated higher sales from each dollar unit invested in its assets.
Table 7. Asset Turnover.
Profitability Ratios
Different profitability ratios have been calculated, and their values are given in Table 8.
Table 8. Profitability Ratios.
The gross profit margin of the company did not change much as a proportion to its sales in the last five years, which implies that it managed its cost of sales efficiently. Furthermore, Table 8 indicates that the operating profit margin of the company improved from 0.20 in 2015 to 0.27 in 2019. It also had a positive impact on its net profit margin as its value also improved from 0.17 to 0.24 in that period. The company’s strong profitability is also reflected from its return on equity ratio value, which increased from 0.29 in 2015 to 0.42 in 2019. However, it is noted that the company had a low return on assets that should be improved.
Solvency Ratios
Table 9 provides values of two solvency ratios, which are measures of the company’s long-term capital structure.
Table 9. Solvency Ratios.
It is noted from Table 9 that the company’s long-term debt to total equity ratio value increased from 2015 to 2017, which was due to its low profitability. However, the company managed to improve its earnings position in 2018 and 2019 that resulted in larger repayments. A similar trend was observed in the value of debt to equity, which also increased until 2017 and then declined.
Cash Flow Ratio
The cash ratio value of Coca Cola remained within a close band, as it was 0.27 in 2015 and 0.24 in 2019, which is also shown in Figure 6. Although it improved in 2016 despite low profitability, its value declined in 2017 as the company settled its tax liability account that resulted in an operating cash outflow.
Table 10. Cash Ratio.
Market Performance Ratios
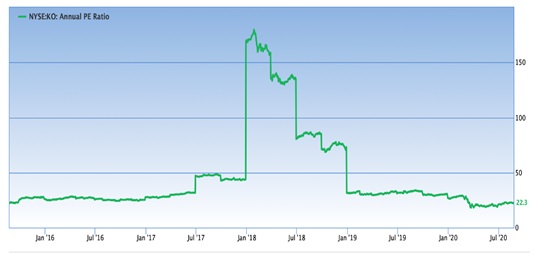
The P/E ratio of the company increased from 22.52 in 2015 to 146.32 in 2017. However, it declined in the last two years, which is also shown in Figure 7. It is noted that the company’s shares were trading high multiples of its earnings per share, which suggest that investors and shareholders had positive views about the company and its businesses. It was the reason that they were willing to pay a high price for its stocks.
Table 11. P/E Ratio.
Projected Financial Statement
The consolidated income statement of Coca Cola is forecasted based on the following assumptions:
- The company’s sales increased by an average of 1.68% in the last two years. However, it is expected that its sales in 2020 will be lower due to coronavirus. Thus, it is anticipated its sales will increase by just 0.5%.
- Other items of the income statement will be determined based on the vertical analysis of the last year’s financial statement.
Table 12. Forecasted Income Statement.
Break-even Analysis
The break-even analysis of the company is performed in the following:
- The company sold different products and brands, which differed in their prices, sales, and cost of production.
- The revenue of Coca Cola was $37,266 million, and the cost of goods sold was $14,619 million in 2019. The cost of goods sold is the variable cost of production.
- Other variable costs include other operating charges of $458 million in 2019.
- The company’s fixed costs include selling, general, and administrative expense of $12,103 million in 2019.
Break-even Level = Fixed Costs / (Net Operating Revenues – Variables Costs)
Break-even Level = 12,103 / (37,266 – 14,619 – 458) = 12,103 / 22,189 = 0.54545 or 545,450 units.
Conclusions
This study is aimed to explore reasons for Coca Cola to make operational improvements for better performance as its financial position was weakening despite its worldwide success. The report focuses on the primary concerns regarding the products of the company, which relate to their harmful effects on human health. The demand for carbonated beverages is slowing down as consumers are increasingly becoming aware of their high sugar content, causing an increase in the number of obesity cases.
The industry analysis indicates that companies are focusing on meeting consumers’ demands and expectation and sustainability of their operations. The refreshment has grown significantly over the years, and new companies are entering into global markets every year, making it a highly saturated and competitive industry. This is a significant threat to the company’s business and its products, which also creates opportunities for companies like Coca Cola that have a strong financial position to diversify their product portfolio and focus on aligning their strategy with consumer requirements.
The SWOT analysis of Coca Cola indicates that its strengths include significant corporate brand, popular product brands, distribution controls, large market share, and strong customer loyalty. Coca Cola is a leading beverages company in the global industry, which has a corporate history of more than 150 years and operates in 200 markets selling different brands and products. On the other hand, its weaknesses include poor water management and centralized business model that lacks focus on health issues. There are opportunities for the company to develop new items and make acquisitions of brands that have a stronger position in the healthy drinks market.
Furthermore, it is indicated that strict governmental laws and regulations affect the company’s operations. Coca Cola, like other companies, faces tremendous challenges as consumer demand for carbonated drinks is declining. The leading competitor of Coca Cola is PepsiCo which also faced a significant decline in its revenue from carbonated beverage sales. Both companies have invested millions of dollars on rebranding their existing products and promoting new healthy products. It is indicated that Coca Cola has effective product development and marketing strategies as compared to PepsiCo. Its marketing plan shows that it targets adolescents and youths.
Furthermore, its pricing strategy is responsive to the decisions taken by its competitors. The company’s management acknowledges that the global market is changing rapidly, and customers are becoming health cautious. The profitability of the company remained strong in the last five years, but there were significant variations in its earnings. However, the financial analysis indicates that the company’s liquidity and solvency positions were weak. The analysis shows that the company failed to achieve high earnings’ growth. Furthermore, the current pandemic situation and the slowdown in the global demand for carbonated drinks are expected to hinder the growth of Coca Cola.
Recommendations
The findings of this report indicate that although Coca Cola has a dominant position in the global beverages market and has a strong financial position, its business and marketing strategies are lacking clarity. The reason for this claim is that the company has many brands and differentiating them by consumers is difficult as there are different products sold in the same market. Moreover, the brand ‘Coca Cola’ is highly popular and strong, which makes it difficult for the company to separate it from negative criticism. Customers relate Coca Cola brand with unhealthy products that have harmful effects on human health. It is recommended that the company should invest in developing a separate entity to sell healthy products such as fresh juices and other soft drinks without soda.
This business should be promoted by adopting a strategy that targets customers’ concerns and fears related to carbonated drinks. Negative marketing could affect the company’s business of carbonated beverages. However, the consumer demand for healthy beverages is growing, which is already affecting the sales of the company. It is recommended that the company should target young customers by developing new brands and products that they could easily connect. It is noted that the company’s social media marketing could also be improved. The company should create apps that provide details of its products, including their ingredients and calories, which are available in different markets. Furthermore, the company should concentrate on its high-performing products and stop selling low-performing brands or products.
Moreover, the company could develop interactive games for young audiences to engage them and help them learn about its bottling business and products. Finally, it is recommended that the company should invest in farming fresh ingredients to control the costs of producing healthy drinks and lower its prices. It will create a higher demand for its products by young customers.
References
Abbis, H. (2017). Marketing strategies of Coke: An overview. KAAV International Journal of Economics, Commerce & Business Management, 4(2), 194-199.
Ciafone, A. (2019). Counter-Cola: A multinational history of the global corporation. University of California Press.
GuruFocus. (2020). Coca-Cola Co. Web.
Jones, P., & Comfort, D. (2018). The Coca Cola brand and sustainability. Indonesian Journal of Applied Business and Economic Research, 1, 34-46.
Kalashnikov, S., & Lutsenko, R. (2020). Investment analysis of Coca Cola Hellenic Bottling Company. Bulletin of V. N. Karazin Kharkiv National University Economic Series, (98), 145-157.
Olukayode, A. (2017). An investigation of the organizational culture of enterprise, on the example of the “Coca-Cola Company”. [Unpublished master’s dissertation]. Ternopil Ivan Puluj National Technical University.
Serodio, P., McKee, M., & Stuckler, D. (2018). Coca-Cola – A model of transparency in research partnerships? A network analysis of Coca-Cola’s research funding. Public Health Nutrition, 21(9), 1594-1607.
The Coca Cola Company. (2016). The Coca Cola Company – US SEC 2016 Form 10K. Web.
The Coca Cola Company. (2018). The Coca Cola Company – US SEC 2018 Form 10K. Web.
The Coca Cola Company. (2020). The Coca Cola Company – US 2019 SEC Form 10K. Web.
Yahoo! Finance. (2020). The Coca-Cola Company (KO). Web.
Zhang, Z. (2019). Risk analysis of two leader drink company: PepsiCo and Coca-Cola. Asian Business Research, 4(3), 42-47.