Introduction
This research paper seeks to relay a detailed discussion of financial issues of Blackberry- a Company based in Canada. Blackberry is a Canadian based company that was founded in 1984 by a twenty three year old college drop out named Lazaridis and his partner Doug Fregin (Livingston 2008, pp. 254)
History of development of Blackberry
During the company’s inception, Steve jobs of Apple launched the first Apple Operating system (Macintosh). The company was started in Waterloo, Ontario Canada. Blackberry is public limited company, which is listed in major stock markets including NASDAQ (Livingston 2008, pp. 254). It is therefore, before law, a legal person and is expected to comply with all the rules and regulations as provided by the law. Between 1980 and 1998, research in motion formed partners with other experts like Rogers and Ericsson and started building radio transmitters and modems, which facilitated data and message transfer over mobile networks. During the same period, RIM developed the world’s first two-way pager. The company majorly deals in Smartphone, like Blackberry handset, and offers wireless communication devices such as servers and online communication platform (blackberry e-mail services). According to Plunkett (2008, pp. 175), the company has wide market coverage across the world. It has subsidiaries in the U.S., North America, Asia and Europe. New York, Toronto, London, Paris, Dubai, Johannesburg, Jakarta and New Delhi are some of the major towns in which the company has its branches. The market coverage has majorly concentrated on developed countries. This implies that the company is well established and possesses the necessary resources required to meet customers’ needs. This reflects the vast capability of the company in terms of resources (financial, human resource, expertise and know how). The company is worth billions of dollars in terms of assets and equity. These therefore reflect the company’s size. Within the last decade, the company has been able to install its devices in every department of the U.S. government and throughout the U.S senate and the house representative (Waters 2006, pp. 197). The company successfully managed to provide some of the world’s largest corporation with efficient effective and secure e-mail account. In 2003, the company’s phone- Blackberry- was developed from just a mere device to an efficient Smartphone. In 2007, the company in an attempt to regain the lost market share introduced a new product in the market, the Blackberry 10. Launching of this product was part of the company’s strategy to maintain its market share and competitive strength (Lee, Lee & Lee 2009, pp. 175). In 2008, launching of Blackberry storm- a full touch device- stormed the market. The brand was a major threat to Blackberry’s competitors like Nokia. During the year 2012, the company formulated a competitive strategy to introduce a new brand, Blackberry 10. The event never took place instead; the company’s history was marked by a shocking resignation of co- CEO. The event was unfavorable to the company’s performance financially and management wise (Livingston 2008, pp. 245).
Financial Analysis
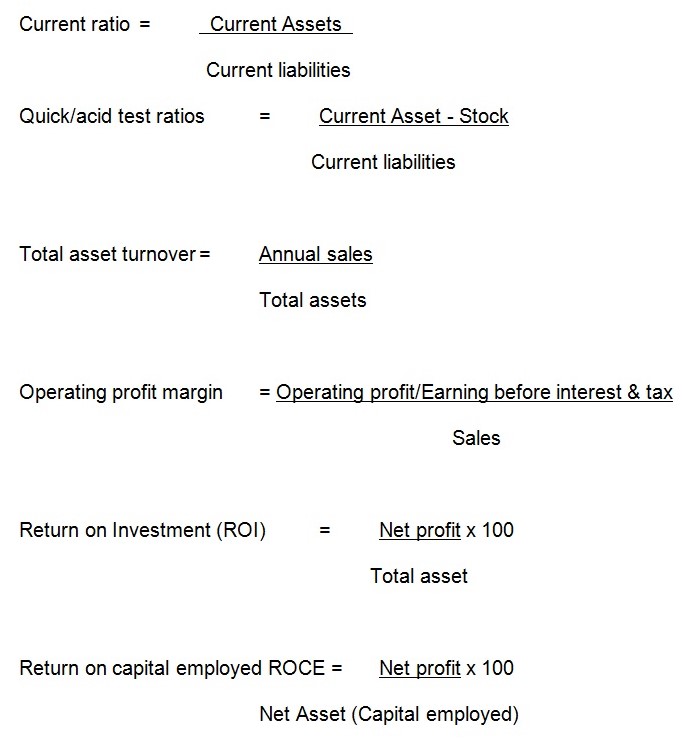
Financial analysis is a process-conducted by financial managers- of identifying the financial performances of a company by comparing the items in profit and loss account and those in balance sheet. This is so because the items in the profit and loss account emanates from those in the balances sheet (Shim & Siegel 2007, pp. 213) For example, the values of assets found in the balance sheet are responsible for sales, revenues and expenses to be found in the profit and loss account. The process involves activities like comparison of sales levels for different financial periods. The process also involves conducting ratio analysis for example, quick ratio analysis, to say the least. The information is important to various stakeholders including, shareholders, lenders, the government, suppliers and the company management team. Shareholders or actual owners are interested in a company’s both long and short-term life. For this reason, they are interested in ratios such as profitability ratios (which seek to establish the viability of a company) and dividend ratios (which seeks to establish returns to owners in form of dividends (Wilson & Machugh 1987, pp. 177). Creditors of a company are interested in a company’s ability to meet its short-term obligations as and when they fall due. They will need like liquidity ratio (which seeks to measure a company’s liquidity position) and current ratio (which measures a company’s quantity of current assets against current liabilities. Long-term lenders to a company have both long and short-term interest in a company’s ability to pay both interest and principal amount of debt as and when they fall due. They therefore use liquidity ratios (to assess short-term ability to meet current obligations), profitability ratios (to ascertain whether a company can pay its principle), gearing ratio (to gauge a company’s risk in an investment) and investment coverage ratio (to ascertain the company’s safety as regards the payment of interest to the lenders) (Johnston 1992, pp. 229). Directors and management of a company are interested in the efficiency of a company to generate profits, the company’s viability from the investor’s point of view, the company’s ability to generate sufficient returns to investors and gearing ratio to gauge the safety and risk associated with the company. Potential investors of a company are interested in a company’s both long and short-term ability to generate acceptable return on their money. The government is interested in a company’s profitability levels in order to ascertain the levels of tax liabilities. A company’s competitors are interested in its performance as reflected by the market share and will use ratios that portray the company’s competitive strength; like sales on return ratios. Customers are interested in the company’s ability to provide goods and services both in long and short-term (Gill & Chatton 2001, pp. 222). Financial analysis is important because it measures the company’s past performance and change in performance –whether to favorable or unfavorable side. Such comparison is then used to interpret the company’s performance, bearing in mind the factors that influence both the present and past performances. Financial analyses are also important because they indicate the average performance of various companies in a given industry, for example, Blackberry, Apple and Samsung. The analysis provides analysis of the minimum and maximum performance of a number of companies in an industry and therefore, identifies both strong and weak companies (Kwok 2008, pp. 275). The process also provides deeper insights into why a company is performing the way it does. The analysis is also important because it is used in fast tracking the performance of an institution. The following are some of the ratio analysis to be conducted on Blackberry Company: quick ratio, return on capital employed, capital turnover ratio, operating ratio, operating profit margin, current ratio and investor ratio. The following are some of the items in the financial statements of Blackberry for the year 2011 that will be used to conduct financial analysis in the areas stated above. Current assets (7298978), stock (678878), current liability (3834384), total assets (12085397), net assets (8251013), number of ordinary shares (2094672), sales (5494501), Earning before interest and tax (1244779). In the year 2011, the company’s quick ratio was 1.727, Return on capital employed(ROCE) is 15.09%, capital turn over is 0.4546, operating ratio (ROI) is 68.27%, operating profit margin is 22.65%, current ratio is 1.904 and Earning per share of 0.594.
Quick ration is a more refined current ratio that excludes amount of stock of a firm. Stock is excluded for the two reasons: they are valued based on historic cost and secondly, they may not be converted into cash very quickly. The ratio therefore indicates the ability of the firm to pay its current liabilities from liquid assets of the firm. In 2011, Blackberry had $1.727 of its most liquid asset to cover for the $ 1 of its liability. Operating profit margin of a company indicates its ability to control its operating expenses such as distribution cost, salaries and wages. In 2011, Blackberry recorded a ratio of 22.65%. This implies that 77.35% of sales related to both operating and cost of sales expenses and 22.65% of sales remained as operating margin profit. Return on investment indicates the return on profit from an investment of $1. In 2011, analysis indicates that Blackberry had 68.27%. This means that $10 of the net assets generated $6.827 of net profit. Return on capital employed indicates the returns of profitability for every $1 of capital employed in the company. In 2011, the ratio for Blackberry indicates that every $10 of capital invested generated $1.509 of profit. Earnings per share of a company indicate how much profits are attributed to every share held by an investor. In 2011, $0.594 of profit was attributed to every share of the company. Capital turnover/ fixed assets turnover indicates the amount of sales revenue generated from utilization of $1 of total assets. In 2011, Blackberry was able to generate $0.4546 form the utilization of $1 of the total assets. Finally, current ratio indicates the number of times the current liabilities can be paid from current assets before they are exhausted. In 2011, Blackberry could pay its current liabilities 1.904 times. After which, they would be exhausted.
The following are some of the items in the financial statements of Blackberry for the year 2012 that will be used to conduct financial analysis. The amounts are in dollars. Current assets $7202, stock $868, current liability $3564, total assets $14037, net assets $10197, number of ordinary shares $2416, sales $5169, Earning before interest and tax $330. In the year 2012, the company’s quick ratio was 1.777, Return on capital employed(ROCE) is 3.237%, capital turn over is , operating ratio (ROI) is 2.35%, operating profit margin is 6.384%, current ratio is 2.021 and Earning per share of 0.1366.
In 2012, Blackberry had $1.777 of its most liquid asset to cover for the $ 1 of its liability. Operating profit margin of a company indicates its ability to control its operating expenses such as distribution cost, salaries and wages. In 2012, Blackberry recorded a ratio of 6.384%. This implies that 93.616% of sales related to both operating and cost of sales expenses and 6.384% of sales remained as operating margin profit. Return on investment indicates the return on profit from an investment of $1. In 2012, analysis indicates that Blackberry had 2.35%. This means that $10 of the net assets generated $0.235 of net profit. Return on capital employed indicates the returns of profitability for every $1 of capital employed in the company. In 2012, the ratio for Blackberry indicates that every $10 of capital invested generated $0.3236 of profit. Earnings per share of a company indicate how much profits are attributed to every share held by an investor. In 2012, $0.1366 of profit was attributed to every share of the company. Capital turnover/ fixed assets turnover indicates the amount of sales revenue generated from utilization of $1 of total assets. In 2012, Blackberry was able to generate $0.3682 form the utilization of $1 of the total assets. Finally, current ratio indicates the number of times the current liabilities can be paid from current assets before they are exhausted. In 2012, Blackberry could pay its current liabilities 2.021 times. After which, they would be exhausted. An industry analysis show that Apple incorporation performs better than Black berry due to its strong brand and high quality products. Apple’s strategy to embark on custom-made products has captured large market. Therefore, is competitive strength is second to no any other in the industry. An industry analysis show that both Blackberry and Samsung exhibit similar competitive strength.
Changes in ratios
From the analysis conducted, it is evident that there are variances in the ratios between 2011 and 2012. Using 2011as a base year, quick ratio increased with 0.05. The change is considered good because there was an increase in the liquidity of the company thus operating expenses would be met as and when they are due. This increment can be attributed to increase in the value of current assets, reduction in the value of stock or reduction in the total value of current liabilities. The analysis indicates a serious decrease in Return on Capital Employed by 11.854%. The change is unfavorable to the company because its profitability for every $1 of capital employed was reduced. The decrease could be attributed to increase of operating expense, low sales level or high cost of sales. The named attributes result into low earnings before interest and tax (EBIT). The decrease could also be attributed to increase in capital employed with a stagnant level of earnings before tax. The analysis shows a decrease in Capital turnover by 0.0864. The direction of the variance is unfavorable to the company because the amount of sales generated from the utilization of total assets decreased. The decrease can be attributed to commodity price decrease, stiff competition that reduced the sales levels or increase in the total assets while other factors remain constant. The analysis indicates a decrease in the operating ratio by 65.92%. This is a serious negative decrease because return to the company from a $1 investment reduced. This reduction could be attributed to increase in total asset while other factors remain constant, increase in the operating expenses, reduction in sales levels or increase in cost of goods sold. From the analysis, the operating profit margin decreased by 16.266%. The decrease is considered unfavorable because it shows the inability of the company to control its cost centers. The decrease could be attributed to an increased levels of operating costs, high sales levels or low levels of Earnings before interest and tax. The analysis indicates that current ratio increased from 1.904 in 2011 to 2.021 in 2012. The increase is favorable for Blackberry because the company could pay its current liabilities twice- with its current assets- before they could be exhausted. In addition, the most recommended current ratio is 2.0 because current assets should at least be twice as high as current liabilities. From the analysis, earnings per share of the company decreased by 0.4574. The decrease is unfavorable because the company’s profit attributed to every share decreased. In other words, the amount of earnings from every share to shareholders has been reduced. Thus, shareholders will be earning less compared to the figures in 2011. The decrease could be because of unfavorable changes in the EPS components. That is, decrease in earning before interest and tax due to decrease in the sales level, increased in the cost of goods sold and increase in operating expenses.
Sources of finance
Section one: areas of interest when considering a loan application
Every organization that seeks for a loan has an investment project. Loan applications are made by entities with deficit finances, to entities with surplus finances. Lending institutions can be commercial banks, hedge funds, Federal Reserve institution, World Bank and International Monetary fund. The lending process begins with an application made by the borrower to the lender. The lending institution, upon receiving the application, conducts an approval process to ascertain qualification of the borrower for loan consideration (Seabrooke 2006, pp. 115). The main areas of concern are credit assessment, business assessment and capacity to pay. During credit assessment, the lending institution will be interested in determining whether the borrowing entity has guarantors and if yes, whether the guarantors meet credit eligibility requirements, the current debt level of both the borrower and the guarantor and what use have the past-borrowed funds been put. A guarantor is the party to loan contract who will be responsible for the full payment of loan amount in the event of failure on the part of the borrower (Pogson 1969, pp. 98). This information is important to provide an assurance to the lender that the lent amount will be recovered according to the terms of the contract. The business assessment process involve ascertaining the feasibility of a project, whether the borrower is the manager of the project and whether the terms of the loan suit the purpose for which it is sought. This process helps the lender to avoid making investments in impractical projects. It also has connection with the assurance of recovering the lent amount. During ability to pay assessment, the lending institutions is interested in ascertaining whether the borrower will be able to pay back the loan by evaluating his personal and business financial information.
The lending institution would be looking for the financial status and credit history of the lender. The lender is very much interested in the historical payment trend of the borrower because that signifies expected future payment behavior. A borrower with credit history characterized with continuous default in loan payment has a very slim chance of qualifying for a loan consideration. In other words, a borrower with a good credit history has a good chance of loan approval whereas; a borrower with bad credit history stands a slim chance of loan approval (Pogson 1969, pp. 99). The lending organization would also be looking at the capacity of the borrower to repay the loan. The projected cash flow statement of the project will reflect the same. A project with a positive cash flow is highly approved for loan consideration whereas; projects with negative cash flows are rejected. This is so because the lending institutions focus on the cash flow to be the basis of loan repayment. Another important area that should be given more weight is collateral. An asset (fixed asset) serves as a secondary security to the loan. In case of default in loan repayment, the lender would recover the amount by liquidating the assets. The lender will also conduct an evaluation of whether the project to be funded meets all the applicable Federal, state and local planning, environmental and programming requirements. Following loan evaluation is the approval or rejection. If the loan is approved, the parties sign the agreement document and the contract becomes legally binding. The last process is the disbursement of the amount requested to the borrower according to the arrangements (Seabrooke 2006, pp. 144).
Purpose of obtaining finance for large companies
According to Seabrooke (2006, pp. 233), operational activities of a business need funds to facilitate the processes. Large business like Blackberry Company and Apple would therefore obtain finances for the following reasons: to finance working capital, growth, expansion of businesses, obtaining of assets, seeking for an alternative source of finance and t acquisition of equity. Businesses borrow to finance working capital, a company like Blackberry should borrow funds and invest in inventories and other working capital before revenues are due to be collected from customers. This works this way, the company borrows funds and uses them to buy inventories that are then converted into cash. The cash is therefore, used to pay for the cost of purchasing the inventories. Large companies like Blackberry can also borrow funds to manage the levels of growth. Return on equity analysis can be done on the company to ascertain the levels of the company growth without obtaining more external funding. When the company‘s growth rate is higher than it can manage, it needs to borrow from an external source to finance the growth. This is true because when a business is increasing its market coverage or opening up new subsidiaries in different locations, it will need substantial amount of funds (Pogson 1969, pp. 178). These funds may not be available from the internal sources like retained earnings, and thus should be sought from the external sources and used to finance the growth activities of a company. If a company cannot easily obtain funds from either internal or external source, it should control its growth activities to manageable levels. Unfortunately, if a company’s growth levels are not managed, the resultant could be major business fallout. Expansion of a business is another issue that requires an external source of finance. A part from seeking for external funds to finance a company’s growth activities, it can be to finance a sudden company expansion. A company like Blackberry would plan to make a quick expansion through acquisition processes. The process needs a substantial amount of money that would not be available internally. This kind of investment decision is considered to increase the value of the acquiring firm (Blackberry) (Pogson 1969, pp. 134).
Pogson (1969, pp. 299) asserts that a company could also borrow to finance acquisition of an asset or an equipment to facilitate activities of the business. Although there is another way of possessing an equipment- through leasing- though some companies do not prefer the process because it lowers a company’s credit rating. Companies have indefinite life span. Shareholders, on the other hand, can change their shareholding positions in various companies. If a major shareholder in a company quits by withdrawing the ownership, then the company could resort to borrowing in order to finance the amount by which the remaining equity is deficient.
Determinants of sources of finance
According to Shah (1995, pp. 123), there are numerous sources of funds including equity capital, debt finance, bills of exchange, lease finance, overdraft sources, debenture finance, venture capital and retained earnings, ordinary share and preference share. Some of the factors that determine the choice of a source of finance are risk, cost of the source, control and flexibility. Cost– every source of finance has some cost attributable to it. For example, in comparing the cost attributed to equity source of finance and debt source, the tax allowable characteristic of debt finance renders it less costly as compared to equity source. Therefore, for companies that seek to minimize the cost of borrowing funds, debt finance is the way to go (Shah 1995, pp. 124). Risk– every company that is operational stands a chance of encountering some elements of risk. For example, debt source of finance is so risky because during tough financial times, a company could default to serve the loan interest and thus risks being rendered bankrupt (Mahagaonkar 2009, pp. 153). Control– control of the management and decision making in a company is affected by the levels of debt finance of a company. Shareholders who are determined to maintain the control over the company should use debt finance to a limited level. Flexibility– in the current highly dynamic financial market, organizations should adopt a dynamic financial structure to facilitate a flexible financial performance. During financial deficiencies, companies need funds to meet operational needs. A highly leveraged company is highly inflexible and faces difficulties in generating funds. As a result, for flexibility, a company should limit its use of debt finance (Magoon 2008, pp. 204).
Section two: lend Blackberry Company 10% of the total net asset as a ten year loan
Assuming the capacity of a lender, the following are the evaluation results upon loan application from Blackberry. From the financial statements of the company during the third quarter of 2012, the company seems to have no guarantor. The eligibility of the company, though, is credible since it is a well-established company. Assuming that this loan application was made in 2012, 10% of the total net asset (0.1*10473) equals $1047.3. Considering cash equivalent at the end of third quarter in 2012 ($1123). The debt level of the company is very low and one of the debt finance source to the company is through purchase of Treasury bond, which could be maturing in 30 years. From the assessment of the company’s cash flow, the investment activities of the company are feasible. To mention a few, they include business acquisitions, acquisition of plant, property and equipment, acquisition of intangible assets and acquisition of long-term investments. When evaluating the ability of the company to pay its debts, cash flow statement was consulted to make a conclusion that end period cash equivalents are enough to service the loan applied for by the company within the required duration. The business assessment process has provided clear evidence that the company’s financial status is good. The company is eligible for a loan contract and has a low debt level. The investments made form a solid pack to be considered as a security for loan- incase the company defaults to pay. With available assets for security and a positive cash flow, if the company’s performance continues on the same track then the company qualifies for loan consideration.
Conclusions
According to the company’s cash flow statement, the company has made various investments in different assets like acquisition of long-term investment, acquisition of property, plant and equipments, acquisition of intangible assets, business acquisitions and acquisitions of short-term investments. In the cash flow statement, the company has planned to finance the investment activities through issuance of common shares and purchase of treasury stock. The financial analysis indicated an increase in both return on capital employed and current ratio. The increase meant that the level of the company’s liquidity improved thus, more money was generated from operating activities to meet the company’s operating expenses as and when they fall due. The company, just like any other seeks external funding sources to finance working capital, to manage levels of growth and for expansion. When incorporating the determinants of sources of funds in the context of Blackberry Company, debt finance would be a cheaper alternative compared to equity due to tax allowance on the interest. Therefore, it would be a wise choice to seek for loan. Considering the amount of loan the company is applying for in relation to its end of period cash equivalent, if the company is considered for the loan, there is a slim chance of default. With the current level of debt, additional debt finance would reduce the power of the company’s management to control decision-making processes. However, high levels of debt finance reduce the flexibility of a company to respond to sudden obligations, the company has enough liquid assets to meet unanticipated obligations. Therefore, as a lender, I would consider lending the required amount to the company, because, there is enough evidence that the company will service the full loan amount within the required period otherwise, the company has enough assets to act as security for the loan.
List of References
Blackberry company: investor information, 2013, Web.
Blackberry company: investor information, 2013, Web.
Gill, J, O & Chatton, M 2001, Financial analysis: the next step, Crisp Publications, Menlo Park, Calif.
Johnston, D 1992, Oil company financial analysis in nontechnical language, PennWell Books, Tulsa, Okla.
Kwok, B, K, B 2008, Financial analysis in Hong Kong: qualitative examination of financial statements for CEOs and board members, Chinese University Press, Hong Kong.
Lee, A, C, Lee, J, C, & Lee, C, F. 2009. Financial analysis, planning & forecasting: theory and application, World Scientific, Singapore.
Livingston, J 2008, Founders at work stories of startups’ early days, Berkeley, Calif, press, Berkeley.
Magoon, L, M, 2008, Dictionary of financial formulas and ratios, Global Professional Pub, London.
Mahagaonkar, P 2009, Money and ideas: four studies on finance, innovation and the business life cycle, Springer, New York.
Plunkett, J, W 2008, Plunkett’s advertising and branding industry almanac 2008: the only comprehensive guide to advertising companies and trends, Plunkett Research, Tex, Houston.
Pogson, E 1969, Sources of finance for African businessmen, Milton Obote Foundation, Adult Education Centre, Kampala, Uganda.
Seabrooke, L 2006, The social sources of financial power: domestic legitimacy and international financial orders, Cornell university press, Ithaca (N.Y.).
Shah, A 1995, Fiscal incentives for investment and innovation, World Bank, Washington, DC, [u.a.].
Shim, J, K & Siegel, J, G 2007, Handbook of financial analysis, forecasting, and modeling, Wolters Kluwer/CCH , Chicago, IL.
Waters, C, D, J 2006, Operations strategy, Thomson Learning, London
Wilson, R, M, S & Machugh, G 1987, Financial analysis: a managerial introduction, Cassell Educational, London.
Appendices
Appendix 1: Balance sheet (2011)
Assets
Current
Cash and cash equivalents $ 1,435,437
Short-term investments 340,222
Accounts receivable, net 4,100,655
Other receivables 239,741
Inventories 678,878
Other current assets 280,246
Deferred income tax asset 223,799
Total current assets 7,298,978
Long-term investments 695,698
Property, plant and equipment, net 2,342,993
Intangible assets, net 1,372,300
Goodwill 375,428
Total assets $ 12,085,397
Liabilities
Current
Accounts payable $ 1,274,887
Accrued liabilities 2,277,761
Income taxes payable 187,650
Deferred revenue 89,804
Deferred income tax liability 4,282
Deferred income tax liability 216,865
Income taxes payable 29,741
Total current liability 4,080,990
Shareholders’ Equity
Capital stock 2,094,672
Treasury stock (145,017)
Retained earnings 5,815,411
Additional paid-in capital 195,492
Accumulated other comprehensive income 43,849
Total 8,004,407
$ 12,085,397
Appendix 2: Consolidated statement of operations (2011)
Revenue $ 5,494,501
Cost of sales 3,100,886
Gross margin 2,393,615
Gross margin 43.6%
Operating expenses
Research and development 357,301
Selling, marketing and administration 666,086
Amortization 114,662
Litigation – – – –
Total O.E 1,138,049
Income from operations 1,255,566
Investment income (loss) (1) (10,787)
Income before income taxes 1,244,779
Provision for income taxes (333,666)
Net income $ 911,113
Earnings per share
Basic $ 1.74
Diluted $ 1.74
Weighted average number of common
Shares outstanding (000’s)
Basic 522,436
Diluted 524,406
Total common shares outstanding (000’s) 521,776
Appendix 3: cash flow statement (2011)
Cash flows from operating activities
Net income $ 2,476,719
Adjustments to reconcile net income to net cash provided by
Operating activities:
Amortization 616,524
Deferred income taxes 24,366
Income taxes payable 1,154
Stock-based compensation 52,070
Other 22,578
Net changes in working capital items (188,913)
Net cash provided by operating activities 3,004,498
Cash flows from investing activities
Acquisition of long-term investments (698,672)
Proceeds on sale or maturity of long-term investments 698,343
Acquisition of property, plant and equipment (735,151)
Acquisition of intangible assets (192,310)
Business acquisitions, net of cash acquired (332,910)
Acquisition of short-term investments (410,365)
Proceeds on sale or maturity of short-term investments 676,766
Net cash used in investing activities (994,299)
Cash flows from financing activities
Issuance of common shares 17,020
Tax benefits (deficiencies) related to stock-based
Compensation (304)
Purchase of treasury stock (59,721)
Common shares repurchased (2,076,797)
Repayment of debt –
Net cash used in financing activities (2,119,802)
Effect of foreign exchange loss on cash and cash
Equivalents (5,821)
Net increase (decrease) in cash and cash equivalents for
The period (115,424)
Cash and cash equivalents, beginning of the period 1,550,861
Cash and cash equivalents, end of the period $ 1,435,437
Cash and cash equivalents $ 1,435,437
Short-term investments 340,222
Long-term investments 695,698
$ 2,471,357
Appendix 4: consolidated balance sheet (2012)
Assets
Current
Cash and cash equivalents $ 1123
Short-term investments 184
Accounts receivable, net 3929
Other receivables 339
Inventories 868
Other current assets 574
Deferred income tax asset 185
Total current assets 7202
Long-term investments 195
Property, plant and equipment, net 2730
Intangible assets, net 2472
Goodwill 659
Total assets $ 14037
Liabilities
Current
Accounts payable $ 975
Accrued liabilities 2394
Income taxes payable $14
Deferred revenue $195
Deferred income tax liability 262
Total current liabilities $3840
Shareholders’ Equity
Capital stock and additional paid-in capital $2,416
Treasury stock (2097)
Retained earnings 8038
Accumulated other comprehensive income (loss) $40
10197
$ 14037
Appendix 5: Consolidated statement of operation (2012)
Revenue $ 5169
Cost of sales 3759
Gross margin 1410
Gross margin 27.3%
Operating expenses
Research and development 369
Selling, marketing and administration 567
Amortization 146
Total operating expenses 1082
Income from operations 328
Investment income (loss) 2
Income before income taxes 330
Provision for income taxes (65)
Net income $ 265
Earnings per share
Basic $ 0.51
Diluted $ 0.51
Weighted average number of common
Shares outstanding (000’s)
Basic 524139
Diluted 524,139
Total common shares outstanding (000’s) 524160
Appendix 6: cash flow statement (2012)
Cash flows from operating activities
Net income $ 1289
Adjustments to reconcile net income to net cash provided by
Operating activities:
Amortization 1134
Deferred income taxes 5
Income taxes payable (17)
Stock-based compensation 63
Other 17
Net changes in working capital items (629)
Net cash provided by operating activities 1862
Cash flows from investing activities
Acquisition of long-term investments (166)
Proceeds on sale or maturity of long-term investments 366
Acquisition of property, plant and equipment (713)
Acquisition of intangible assets (1178)
Business acquisitions, net of cash acquired (226)
Acquisition of short-term investments (137)
Proceeds on sale or maturity of short-term investments 462
Net cash used in investing activities (2371)
Cash flows from financing activities
Issuance of common shares 9
Tax benefits (deficiencies) related to stock-based
Compensation (2)
Purchase of treasury stock (150)
Common shares repurchased (-)
Net cash used in financing activities (143)
Effect of foreign exchange loss on cash and cash
Equivalents (16)
Net increase (decrease) in cash and cash equivalents for
The period (668)
Cash and cash equivalents, beginning of the period 1791
Cash and cash equivalents, end of the period $ 1,123
Cash and cash equivalents $ 1123
Short-term investments 184
Long-term investments 195
$ 1502
Appendix 7: Financial ratios formulae