This entails an overview of key issues arising from the SunnyBee case study analysis. SunnyBee needs to align its business goals with the analytical objectives to enhance the performance of the company and minimize mismatches in its priorities. Sanjay and his father developed a data-driven company. The adoption of analytics should follow business goals to advance through a given set of maturity steps related to growing competitive edge and value realization. Hence, data are crucial to any start-up making Sanjay design SunnyBee to utilize analytics and information technology to collect and create a sense of data from its partners, consumers, processes, and business settings to attain its business goals (Bridgman et al., 2020). Analytics is a key competency for the company to achieve its business goals.
Current Sources of Data for the Start-up
Data sources change with time and are varied to meet the needs of a start-up or a company. The current source of data for a start-up is big data. SunnyBee needs supplier data, sales data, process data, and consumer data for its business goals. The firm is contemplating the unstructured data analysis from the social media networks to better comprehend and react to consumer opinion (Buiten et al., 2018). This data will help the company confirm its performance and achievement of set business goals.
Big Data/Quality Data
SunnyBee to be a successful start-up need to have high-quality data to make well-informed business decisions when the company is experiencing transformation in business circumstances. If the company has biased, incomplete, or low-quality data, then it cannot make informed decisions when encountering business challenges. For a new start-up to succeed the following are critical features of the data needed for evaluation: validity, reliability, relevance, completeness, and timeliness. However, the collection of bid data for a company should meet the following qualities: volume, variety, velocity, and veracity. These big data qualities communicate the forms of data analytics technologies, storage, and telecommunications network for the company to make use of this data to make better decisions (Buiten et al., 2018). Big data quality ensures accurate algorithms, and minimizes serious errors, or faults because of real-world system results, leading to persistent enhancements in outcomes.
Customer service Model at SunnyBee to Capture Customer Loyalty
Robust customer service may enhance consumer retention and promote repeat business for SunnyBee. Repeat consumers are more valuable as they spend more than the new consumers do. The company can increase its customer loyalty by making customer service at its premises a priority. Sanjay should ensure that the firm provides excellent customer service to its consumers. A consumer examines every relationship he or she experiences with the company’s employees and makes a decision call about SunnyBee’s service. Many consumers highly regard customer service as a critical factor in their brand choice (Jabłoński, 2017). Hence, for a company to improve customer loyalty there it needed to improve its services to consumers.
SunnyBee’s customers prefer to have a unique experience with the brand. For this company to gain customer loyalty, it should have profound customer satisfaction. The company should engage with consumers via the utilization of benefits and cases other than features and functionalities. There is a need to ensure communication is centered on consumers’ experiences other than product characteristics. The firm should embrace post-purchase services to its consumers because it promotes brand loyalty. There are many ways where SunnyBee may enhance its current customers’ post-purchase experiences. These include the provision of installation and other associated services, provision of spare parts and frequent maintenance services, taking frequent customers’ feedback and inquiring about their experience, and provision of care tips for the product. The company should ensure the following are achieved from the customer’s perspective brand quality, experience, image, consumer product engagement, and switching costs to gain a linear correlation with customer loyalty (Kidyaeva, 2020). Since the company gathers data concerning consumers, they should secure their customers’ personal information through effective execution of safeguards to guard consumer data from fraudsters and attackers.
Challenges in Using Analytics at SunnyBee
Data security is one of the challenges of utilizing analytics at the company. This concerns how data is gathered, shared and utilized. SunnyBee must be transparent in how they gather and utilize data. The company should build accountability and trust with its suppliers and consumers who anticipate privacy. Therefore, if the firm fails to respect its consumers’ privacy, then it will stop sharing its data. Currently, data security has become an ethical issue and legal requirement. In most cases, firms collecting data concerning consumers should secure their customers’ personal information. SunnyBee must execute effective safeguards to guard consumer information against data infringements (Kidyaeva, 2020). If the firm fails, secure consumer data it can lose consumer confidence leading to a negative effect on revenue generated.
Further, data breaches could lead to other implications comprising legal penalties. Another ethical issue is who owns the data for gathering supplier and consumer data. As SunnyBee increases in its data transformation, the more ownership they will exercise. Nonetheless, the extent of change needed to transfer ownership is sophisticated. Given that, SunnyBee data collection aims at collecting largely volunteered data emanating from social media sites. In addition, the challenge of the firm experience with big data introduction and other workers are overwhelmed with the amount of data gathered. With this huge data available, the company finds it challenging to dig deep and access the meaningful that are required most (Köppen and Lübcke, 2019). When workers are overwhelmed, they cannot fully examine data, or concentrate on the parameters that are easier to gather other than those that add value to the decisions making.
Case Analysis
Data plays a critical role in business success. Data collected from different sources help the company to make better decisions and gain a competitive edge in the market. First, SunnyBee should collect data from social media sites that currently provide valuable information on how businesses can manoeuvre in the market to increase their customer reach and improve performance. Through the social media platforms such as Facebook, Twitter, Instagram, and LinkedIn the company will have access to data sets with thousands of variables to analyze using the existing analytical technologies. With the advancement in technology, many customers go to social media to articulate their issues with products or services received from a given company (Köppen and Lübcke, 2019). This will present a great opportunity for SunnyBee to access data on consumers’ reactions to their products and services analyze them and make better decisions.
The second data source recommended for SunnyBee to collect data is the interviews, fieldwork, and surveys. The firm can conduct interviews with various stakeholders such as partners, consumers, suppliers, and employees to understand the issues concerning their products, services, and business operations. The information drawn from different will be analyzed to locate areas that need improvements in the company. SunnyBee could carry out surveys on its products to try to predict the future business environment. Surveys are conducted using modern technologies to assess data from different populations in the market. The firm can move a step further and conduct fieldwork on its product popularity and customer service experience to get raw data from partners, consumers, and employees (Paczkowski, 2021). This data collected can be analyzed and conclude how to enhance their product quality and increase brand loyalty.
Internet communications on blogs, email, newsgroups, and listservs can be recommended to the company as primary data sources to collect data on their products and services. Through these data sources, SunnyBee will have direct access to firsthand data on its customers, partners, and employees. Sanjay can access data about their suppliers through email, and analyze it using the analytical tools to understand different trends in their suppliers over the years. Data from newsgroups can be of benefit for Sanjay in comparing different opinions people have towards the company’s operations and products (Paczkowski, 2021).
New Analytical Technologies
Many companies experience the challenge of having a successful project in data analytics to make informed decisions for business success. Further, big transformations will have to take longer until the company realizes its objective. A majority of companies aspire to be data-driven, although a small fraction has achieved this ambition (Rikhardsson and Yigitbasioglu, 2018). Hence, the three analytics technologies that SunnyBee should consider applying to facilitate its business goals are Stream analytics, data virtualization, and data integration.
Stream Analytics
SunnyBee at times data should be processed and stored on multiple platforms and in different formats. For example, its unstructured data from the social media platforms will be in different formats and stored on many platforms. Hence, stream analytics software will be of great advantage for filtering, cumulating, and analysis of these voluminous data (Rikhardsson and Yigitbasioglu, 2018). In addition, stream analytics permits connection to external sources of data and their incorporation into the app flows.
Data Virtualization
This analytics technology supports SunnyBee to retrieve and control data from social media sites and other sources without executing technical restrictions like the physical data location and data formats. Apache Hadoop is applied to distribute data stores for near real-time or real-time access to stored data on different platforms. The company can use data through dashboards, reports, portals, web applications, and mobile apps (Weber, 2020). Data virtualization will allow Sanjay to access and deal with the data sources and abstracted data perspectives in the standard delivery setup.
Data integration analytics
SunnyBee faces the operational challenge of dealing with big data in processing petabytes of terabytes of data in a manner that may be meaningful for consumer deliverables. Data integration analytics will combine data from multiple data sources into a single and integrated view. The process will entail steps like cleansing, mapping, and transformation of data (Weber, 2020). SunnyBee consumer data integration could involve extracting information concerning each consumer from disparate business processes like accounts, sales, and marketing, and integrating them into a single view to be used for reporting, customer service, and analysis.
Conclusion
SunnyBee commenced its journey towards maturity in business analytics with data collection and integration of new technologies. However, the company has not yet attained its data-driven culture ambition potential. The firm has set clear its business goals and analytics objectives with access to relevant data, KPIs (Key Performance Indicators), and models SunnyBee successfully controlled its consumers’ requirements and limitations imposed by its supply chain. The use of data analytics at the company has enhanced customer service where they can now boost improved customer loyalty with an increase in sales revenue over the past few years. The use of data integration technologies supports the company to make informed decisions about its customers. Through data analytics, SunnyBee can understand its consumer experience with its services and products making it establish potential transformations to increase its competitive advantage.
Percentage Contribution of each Genre to the Total Revenue
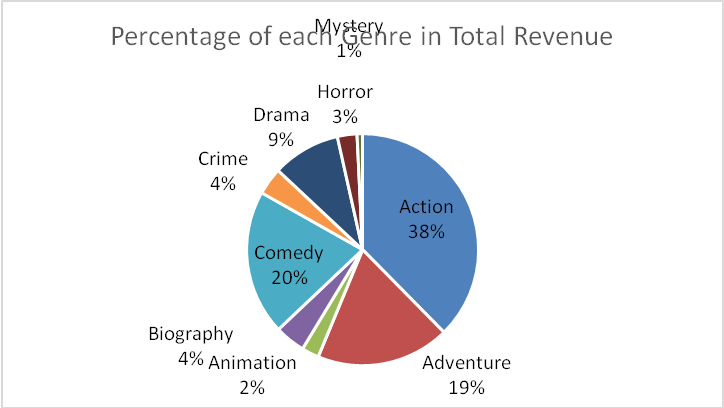
In the excel analysis, a pie chart, shown in the Figure 1, was used to depict the percentage contribution of each genre to the total revenue. The chart reveals that action movies contributed the highest portion to the total revenue at 38%, followed by comedy at 20%, and adventure at 19% (Statista, 2021). The other biography, animation, drama, crime, and horror contribute less than 10% to total revenue while mystery contributes 1%.
Revenue Trend over the Years
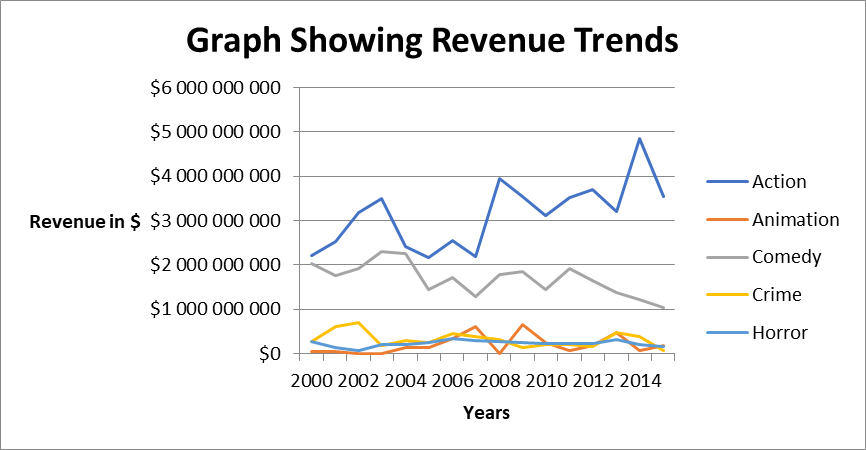
The Figure 2 above reveals the trend of stated genres action, animation, comedy, crime, and horror. The graph has shown that action movies revenue has been increasing and decreasing over the years from $2000 to $3500 million. However, Comedy movie revenues over the years have been declining from $2000 to $1000 million (Statista, 2021). Horror movie revenue over the period has remained relatively stable but lower while animation and crime have been decreasing.
The Type of Excel Chart Selected
Pie Chart
A pie chart was chosen to represent the data of the percentage contribution of each genre to the total revenue. It can be divided into portions that demonstrate the numerical percentage of each portion. The chart is important for comparing various parts of the entire (total revenue) or highlighting a given part of the revenue. This helps users to understand the message behind it at a glance clearly. The information can be categorized based on the variables differently using different colors (Weber, 2020). Hence, creating it easy for one to make fast analysis and understand the information quickly.
Line graph
A line graph was chosen to represent the selected genre action, animation, comedy, crime, and horror revenue trends over the years. The graph was preferred because it displays change/trend over time as a sequence of data points related by a straight line. The line graph assists in determining the association between two sets of values. In this case, it compares the relationship between revenue over years for each genre where one data set depends on the other (Weber, 2020). This makes it easier to compare items over a given time and understand the trends.
Stocktrade Worksheet
Correlation analysis determines the strength of linear association between two variables, for example, Intel and Microsoft, Microsoft and IBM. Hence, it depicts the level of change in Intel because of the change in Microsoft or IBM in share prices. In this case, we calculated the correlation between IBM Price and Intel Price, the correlation between Intel Price and Microsoft Price, and lastly, the correlation between IBM Price and Microsoft Price.
The correlation coefficient lies between a positive one and a negative one. A positive correlation coefficient indicates that as one variable increases, the other variable also increases, and if one variable decreases, the other variable decreases. A negative correlation coefficient indicates that as one variable increases, the other variable decreases, and a correlation coefficient near or equal to zero indicates no correlation between the variables. Therefore, the correlation table shows that the correlation between IBM Price and Microsoft Price is the highest, while the lowest correlation is between IBM Price and Intel Price. The correlation coefficient between IBM Price and Microsoft Price is 0.95, which is a near positive one, which means that the correlation is much stronger than the other correlations between the other organizations (Lee et al. 2016). It is from this observation that one can conclude that the IBM Price increases, the Microsoft Price increases, and if the IBM Price decreases, the Microsoft Price decreases.
Organizations with Highest Correlations in Share Prices
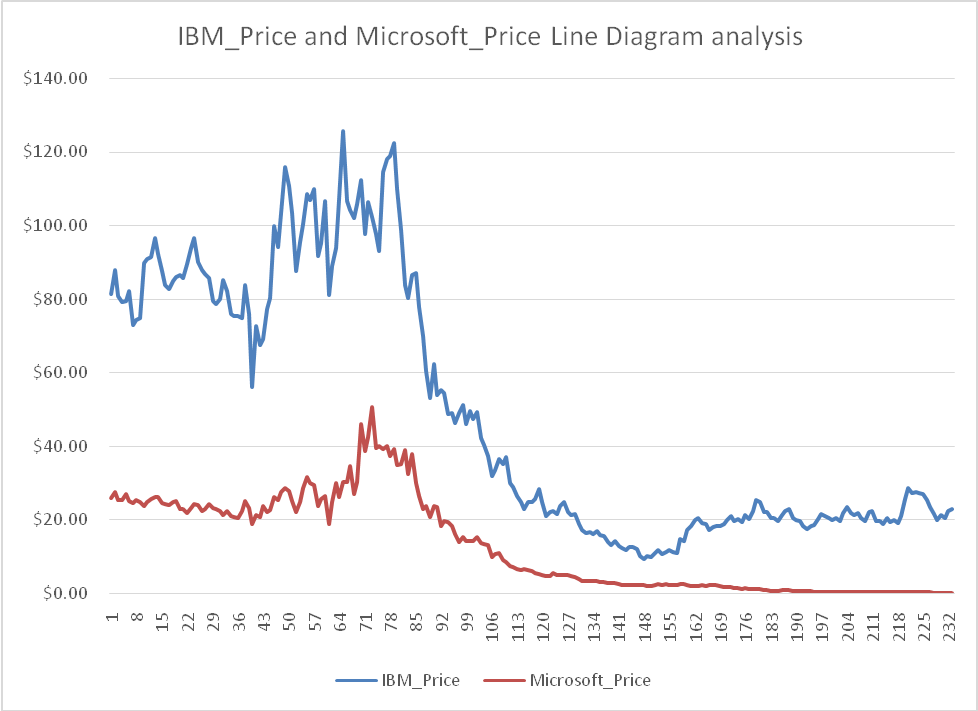
The graph above shows the line diagram plot between organizations with the highest correlations in their share prices, which are IBM and Microsoft. Using the line graph, one can track the changes in the IBM Price and Microsoft Price over a short and long period, and it is from this graph one can easily compare the changes in the prices over the same period for IBM and Microsoft (Yu et al., 2019). From this graph, one can analyze the prices telling the maximum and minimum prices of the organizations. The line graph can display continuous data over time, showing trends in the data at equal intervals or a certain period. In this case, the data is the prices, and it is this trend that helps one-make predictions about the results of data not yet recorded (Weber, 2020). In this case, one can predict that certain volume of shares that can be sold at a certain price
Recommendation to Joe
After visualization of the trend in IBM price vis-à-vis Microsoft share price, one can recommend that Joe should buy Microsoft shares because IBM share price has increased. This implies that the Microsoft share price has increased. Buying a high share price from Microsoft will have certain advantages. It is most trusted, having attracted most investors. In addition, Joe will get high returns most of the time, and in case the price goes down due to rights or bonus issues, he will get a decent profit.
A Good Predictor of Volume Traded
Using the regression summary output, the regression equation is y= -1.75076E-06x+64.17275582. The observations made from this analysis are that the price is not a good predictor of volume traded; since the price is not a good predictor of volume traded, the regression is around 2% which is very low (Chukhrova and Johannssen, 2019). Independent variables are never perfect predictors of the dependent variables. Furthermore, the residuals can help one understand how far away the actual values are from the predicted values.
Reference List
Bridgman, T., McLaughlin, C., and Cummings, S. (2020). Overcoming the problem with solving business problems: Using theory differently to rejuvenate the case method for turbulent times. Web.
Buiten, G., Snijkers, G., Saraiva, P., Erikson, J., Erikson, A., and Born, A. (2018). Business data collection: Toward electronic data interchange. Experiences in Portugal, Canada, Sweden, and The Netherlands with EDI. Journal of Official Statistics, 34(2), 419-443.
Jabłoński, M. (2017). Determinants of the sustainable business model of companies early stage of development. Sustainable Business, Management, and Economics.
Kidyaeva, A. U. (2020). Sustainable development and growth of companies amid uncertainty in the external business environment. Entrepreneur’s Guide, 13(4), 56-63.
Köppen, V., and Lübcke, A. (2019). Relational data access for business data analytics. Business Analytics and Optimization, 17(2), 2020-2027.
Lee, Y., and Barney, J. B. (2016). Strategic factor markets. The Palgrave of Strategic Management, 9(2), 1-2.
Paczkowski, W. R. (2021). Advanced OLS for business data analytics. Business Analytics, 1(3), 279-312.
Rikhardsson, P. and Yigitbasioglu, O., 2018. Business intelligence & analytics in management accounting research: Status and future focus. International Journal of Accounting Information Systems, 29, pp.37-58.
Rikhardsson, P., and Yigitbasioglu, O. (2018). key-technologies-that-enable-big-data-analytics-for-businesses. International Journal of Accounting Information Systems, 29, 37-58.
Statista. (2021). Movie genres by total box office revenue in North America 2021. Web.
Weber, F. (2020). Business analytics und analytics. Künstliche Intelligenz für Business Analytics, 3(1), 1-36.
Yu, M.H. and Wu, J.L., 2019. Ceam: A novel approach using cycle embeddings with attention mechanism for stock price prediction. In 2019 IEEE international conference on big data and smart computing (BigComp) (pp. 1-4). IEEE.