Company Background
History
PepsiCo is the second largest company in the global food and beverage industry. The company was “incorporated in Delaware in 1919 and reincorporated in North Carolina in 1986” (PepsiCo). The company has since expanded its operations by joining over 200 countries. Its major products/ brands are shown in figure 1.
PepsiCo’s vision is to “build shareholder value by becoming a truly sustainable company” (PepsiCo). To realize this vision, the company has focused on protecting the environment and implementing corporate social responsibility activities that improve the welfare of the community. PepsiCo’s mission is “to be the world’s premier consumer products company focused on convenient foods and beverages” (PepsiCo).
Business Divisions and International Operations
The company has six divisions, which include FLNA, QFNA, LAF, PAB, PepsiCo Europe, and PepsiCo AMEA. FLNA produces and distributes several brands of snacks, which include Cheetos, Tostitos, and Doritos. QFNA manufactures and sells cereals, rice, and different dairy products (PepsiCo). The products produced by FLNA and QFNA are sold in North America. LAF produces and distributes various brands of snacks in Latin America.
PAB manufactures and distributes beverages in America. Its main brands include Gatorade, Pepsi, Diet Pepsi, and Mountain Dew. PepsiCo Europe manufactures and sells the company’s products in Europe. Similarly, PepsiCo AMEA manufactures and distributes the company’s products in Asia, the Middle East, and Africa (PepsiCo). Table 1 shows that PAB is the most important division since it generates the highest revenue.
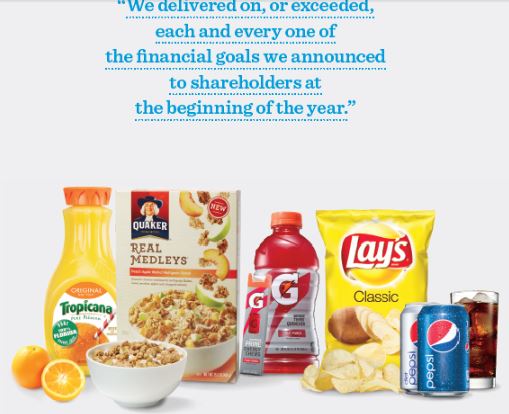
Table 1: Divisions
The company operates in four regions, namely, North America, Latin America, Europe, and AMEA. AMEA refers to Asia, the Middle East, and Africa. North America accounted for 56.9% and 57.4% of the company’s net revenue in 2013 and 2012 respectively.
Internal Analysis
CEO Compensation and Ownership
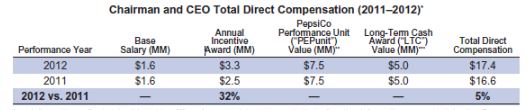
The compensation of the CEO of PepsiCo consists of base pay and annual incentive awards (PepsiCo Proxy Statement). The incentive awards include cash and stock option benefits. The awards are determined by the performance of the CEO. Thus, the total annual compensation of the CEO depends on the extent to which she meets her performance targets.
In 2013, the CEO owned 2,415,785 ordinary shares of the company (PepsiCo Proxy Statement). Table 2 summarizes the components of the CEO’s pay in 2012 and 2011. The large owners of PepsiCo (own at least 5% of its common stock) include Vanguard Group and Malvern P.A.
Corporate Governance
A board of directors supervises the executive management of the company. The board consists of independent directors who have adequate expertise and experience in areas such as finance, accounting, and management. The chairperson of the company is not an independent director since she is also the CEO (PepsiCo Proxy Statement). Consequently, the board has elected a presiding director to improve its effectiveness.
The presiding director has been authorized to approve the decisions made by the board. Shareholders elect the board members annually. The supervisory functions of the board are conducted by three committees, namely, the audit committee, the nomination committee, and the compensation committee. In 2013, Governance-Metrics International ranked the company’s corporate governance as perfect.
Financial Performance
Sales and Operating Profits
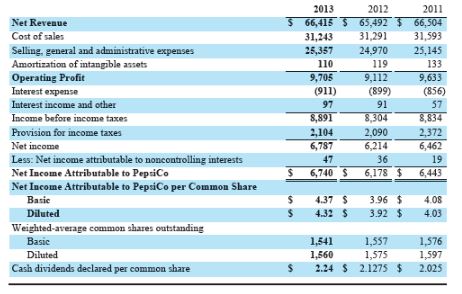
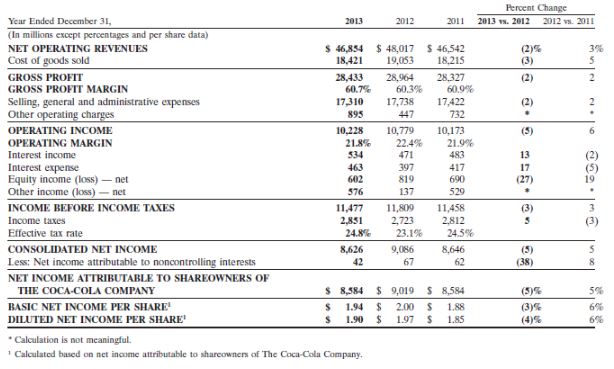
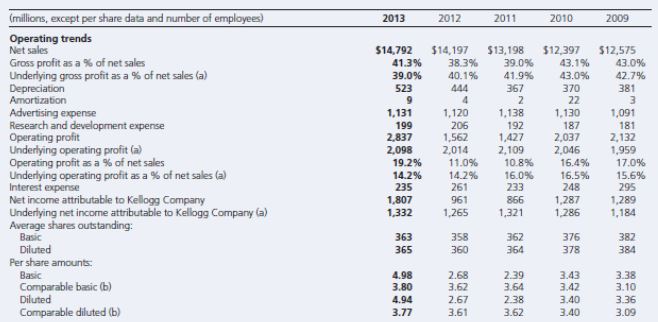
Table 3 shows PepsiCo’s financial performance for the last three years. Table 4 and 5 summarizes the performance of Coca Cola and Kellogg Company, respectively. Coca Cola is PepsiCo’s main competitor in the beverage market, whereas Kellogg Company is its main competitor in the foods market. PepsiCo’s net revenue/ sales decreased from $66,504 million in 2011 to $65,492 million in 2012 (PepsiCo).
However, sales improved by 1% in 2013. By contrast, Coca Cola’s net revenue increased from $46,542 million in 2011 to $48,017 million (3% increase) in 2012 (Coca Cola). However, Coca Cola realized a 2% decrease in sales in 2013. Kellogg Company recorded a 7.6% and 4.2% increase in sales in 2012 and 2013 respectively (Kellogg).
In 2012, PepsiCo’s operating profits decreased by 5%, whereas in 2013 the profits increased by 7% (PepsiCo). By contrast, Coca Cola’s operating profits increased by 6% in 2012 and decreased by 5% in 2013. Kellogg’s operating profits increased by 5.6% in 2012 and 12.4% in 2013.
Key Financial Ratios
Table 5.
Table 5 shows that PepsiCo’s gross/ operating profit margin (GPM) averaged 14.3% in the last three years. By contrast, Coca Cola and Kellogg achieved high average operating profit margins of 60.6% and 39.5% respectively. This suggests that PepsiCo’s cost of goods sold is significantly higher than that of Coca Cola. PepsiCo’s return on assets (ROA) averaged 8.6% in the last three years.
This achievement is comparable to Coca Cola’s 10.2% and Kellogg’s 7.9%. PepsiCo’s price-to-earnings ratio in 2013 and 2012 is significantly less than that of Coca Cola. This suggests that holders of PepsiCo’s stocks received fewer earnings than their counterparts who invested in Coca Cola’s and Kellogg’s stocks.
Share Price
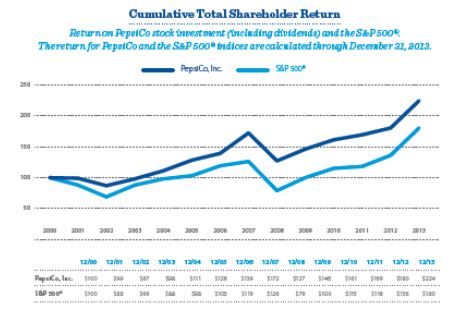
Figure 2 shows that PepsiCo’s total shareholder returns outperformed the S&P 500 index. Specifically, the returns outpaced the index by 170 basis points in the last decade (PepsiCo). Coca Cola and Kellogg Company also reported similar results. This means that PepsiCo’s shareholders expect above market average returns on their investments.
Strategy
Corporate Level Strategy
The company’s corporate-level strategy focuses on improving shareholder value and sustainability (PepsiCo). The company has embarked on producing high-quality products that satisfy the needs of specific market segments. PepsiCo has used effective marketing strategies to create a strong brand image for its products in all markets.
As a result, the company enjoys a high brand loyalty, which in turn improves its sales and market share (Rensburg 4-12). The company also improves the sustainability of its operations by implementing programs that protect the environment, address the needs of the community, and improve the work environment.
Business-Level Strategy
PepsiCo’s business-level strategy focuses on improving the growth of its divisions. The company has invested heavily in research and development to achieve product and process innovation. The main advantage of this strategy is that it will enable the company to differentiate its products to overcome competition (Liu and Lopez 300-317).
PepsiCo has also focused on improving the efficiency of its divisions. Specifically, the company collaborates with third parties such as contract manufacturers and independent distributors to achieve economies of scale in production and distribution. This enables the company to save at least $800 million annually (PepsiCo).
International Level Strategy
PepsiCo focuses on expanding its operations through mergers and acquisitions. This strategy enables the company to penetrate new markets easily, as well as to benefit from the technology and distribution networks of its partners in overseas markets (Rensburg 4-12). However, the strategy is expensive and can lead to failure due to cultural differences.
Analysis of the Competitive Environment
Market Share
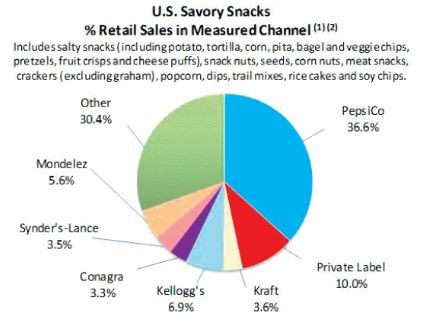
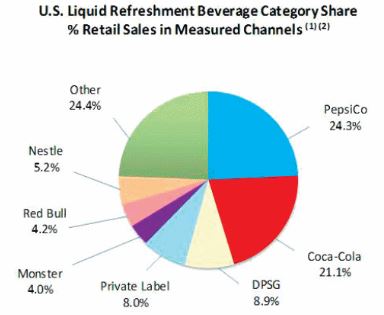
Figure 3 and 4 illustrate the market share of PepsiCo in the food and beverage industry in the US. In the foods market, the company remains the leader. In 2013, its markets share was 36.6%. In the beverages segment, Coca Cola commands 42% of the market, followed by PepsiCo, whose market share is 28% (KPMG). However, sales statistics indicate that PepsiCo’s differentiated brands such as Aquafina and Tropicana, continue to outperform Coca Cola’s premium brands such as Dasani and Minute Maid.
As shown in figure 3, PepsiCo outperforms Coca Cola in sales in the retail distribution channel (PepsiCo). This suggests that the company can take advantage of its ability to produce high-quality products and its control over the retail distribution channel to increase its market share and profits.
Strategic Group Analysis
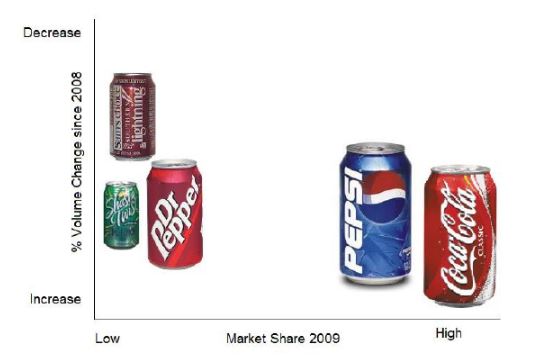
Strategic groups consist of competing companies that have comparable characteristics. In the non-alcoholic beverage industry, Coca Cola and PepsiCo are in the same strategic group. The two companies pursue similar strategies such as differentiation and expansion through mergers and acquisitions. The strategic map (figure 5) shows that the beverage industry has two main strategic groups. The first group consists of rapidly growing firms such as Red Bull and Monster.
The second group consists of dominant firms such as Coca Cola and PepsiCo, which mainly compete in terms of market share and sales volume. Coca Cola leads in terms of sales and market share. However, companies in the first strategic group are gaining market share rapidly (KPMG). This means that PepsiCo has to intensify its marketing activities and to improve the quality of its products to defend its market share.
Competitive Moves
PepsiCo operates in markets that are characterized by perfect competition. Competitive moves in the food and beverage industry are determined mainly by market conditions rather than the strategies adopted by competitors (Cante and Calluzzo 230-240). Companies overcome competition by addressing market needs, such as increased demand for healthy foods and beverages.
External factors, such as economic growth also influence product development and market expansion strategies. Nonetheless, the competitive moves made by major players in the industry still influence PepsiCo’s strategies. For instance, the company had to introduce Diet Pepsi after Coco-Cola launched a similar product to retain its customers.
PESTEL Analysis
The main political factors that are likely to affect the performance of PepsiCo include regulation and taxation. In the US, the Food and Drug Administration (FDA) regulates the food and beverage industry. Thus, PepsiCo is likely to be fined if it fails to meet the standards set by the FDA and regulators of overseas markets. An increase in the corporate tax rate will reduce the company’s profits and vice versa.
The main economic factors that affect performance in the food and beverage industry include GDP growth and exchange rate fluctuations. The expected increase in global GDP growth will improve PepsiCo’s revenues by supporting expenditure on its products (World Bank).
Exchange rate fluctuations affect the cost of importing raw materials, the competitiveness of exported products, and the value of revenues from overseas markets. For instance, a depreciation of the US dollar against major currencies will increase the cost of importing raw materials, thereby reducing the competitiveness of PepsiCo’s products.
Rising concern over the health effects of consuming processed foods and beverages is the major social factor that affects the performance of PepsiCo. Carbonated soft drinks are associated with obesity and diabetes. This has significantly reduced the demand for drinks in the US and Europe, where customers can easily access information on the health effects of consuming various soft drinks (KPMG).
Technology in the beverage industry determines product quality and companies’ ability to improve cost efficiency. For instance, the use of social media and e-commerce platforms enable PepsiCo and its competitors to reduce marketing and procurement costs.
Environmental regulation has negative effects on the performance of manufacturers of beverages, especially in the US and Europe (PepsiCo). In these markets, manufacturers have to pay for polluting the environment. Moreover, they have to invest in programs that protect the environment from averting resistance from the public.
A change in corporate law is the main legal factor that is likely to affect the performance of PepsiCo. Specifically, the company will not be able to expand easily in markets where acquisitions and mergers are restricted by law.
VRINE Analysis
PepsiCo’s resources are valuable since they enable the company to achieve normal profits. For instance, the company has acquired advanced production and supply chain management technologies that enable it to reduce operating costs while producing high-quality products.
The company’s valuable resources, such as talented employees and advanced production technologies, are not rare. Innovative companies such as Coca Cola also have access to the best talent and production technologies in the industry (Coca Cola).
PepsiCo’s resource that is difficult to imitate is its organizational culture. The company’s culture of performance with purpose enables its employees to improve shareholder value sustainably. This enables the company to outperform its competitors who are not able to implement organizational cultures that promote productivity (PepsiCo).
The company’s valuable and imitable resources are exploitable. Since its inception, the company has focused on improving its competence in key business processes such as product development through innovation. As a result, PepsiCo can achieve high financial performance and market valuation.
Recommendation
Based on the analyses in the preceding paragraphs, I recommend the purchase of PepsiCo’s stocks as a medium-term investment. This recommendation is based on the following facts. First, the company has consistently reported high profits in the last three years.
The company’s profits are likely to improve in the future if it implements its expansion plan and cost reduction measures successfully. This means that investors will enjoy high dividends in the future. Second, the company’s performance in terms of ROA is comparable to those of its competitors, such as Coca Cola and Kellogg.
Moreover, the performance of the company’s stock has exceeded benchmark market indices such as the S&P 500. Thus, investors are likely to receive a risk premium by purchasing the company’s stocks. Finally, the company has developed strategies that will enable it to overcome competition and to address threats in the external environment.
For example, it has introduced Diet Pepsi to cater to customers who are concerned about their health. Thus, the company’s financial performance is expected to improve in the future as the economy grows. This will benefit investors in terms of capital gain and high dividends.
Works Cited
Cante, Charles and Vincent Calluzzo. “Strategic Alliances in Food and Beverage and Executive Recruiting Industries.” International Journal of Supply Chian Management 9.3 (2008): 230-240. Print.
Coca Cola. Annual Report: Form 10-K 2013. Web.
Kellogg. Annual Report: Form 10-K 2013. Web.
KPMG. Food and Beverage Industry Outlook Survey 2013. Web.
Liu, Xiaoou and Rigoberto Lopez. “Evidence of Rational Addiction to Carbonated Soft Drinks.” China Agricultural Economic Review 4.3 (2012): 300-317. Print.
PepsiCo. Annual Report: Form 10-K 2013. Web.
—.Proxy Statement and Notice of Annual Meeting of Shareholders 2013. Web.
Rensburg, Deryck. “Strategic Brand Venturing: The Corporation as Entrepreneur.” Journal ofd Business Strategy 33.3 (2012): 4-12. Print.
World Bank. Data Bank 2014. Web.