Introduction
I have chosen to analyze the financial performance of Ryanair holdings, which is listed in New York stock exchange and London stock exchange. It is one of the largest airline with low fair, low ticket fare and it has grown over years to be what it is today. The company has been in business since 1985 and currently it commands a large market share. The financial performance for the company under consideration in this case is for the year 2007 as well as the year 2008.
There are many users to the financial information that I am going to produce and they include the management employees, shareholders, creditors, the government, suppliers and the customers. These groups are interested in the financial performance of this company to assist them in financial decision making when dealing with the company. They also monitor the performance of the company to be able to know its efficiency and whether to enter into contract with them (Glautier M W E & Underdown D 1977 and Holmes, G, Sugden A, Gee Paul, 2008).
Analysis
Liquidity
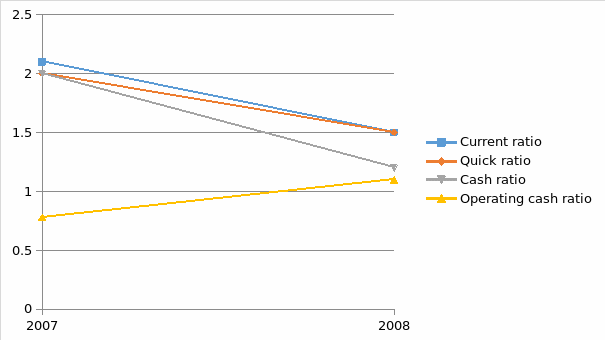
From the appendix of financial analysis one can note that the company performance in terms of liquidity declined from 2007-2008. This is shown by the current ratio, quick ratio and cash ratio.
The current ratio declined from 2.1:1 to 1.5:1. This ratio measures the ability of the firm to meet short term obligations. The quick ratio also declined from 2:1 to 1.5:1 in the year 2007 to the year 2008 respectively. These two ratios have declined although the decrease is not very badly off considering the period of trading. This period experienced a downward trend in the performance of almost all corporations worldwide because of the financial crisis. However this company has managed to cover liquidity which can cover current liabilities with ease. The company being in the service industry has a minimal inventory that is why the current ratio is almost equivalent to quick ratio. In overall this two ratios show that the company is financially stable and can meet short-term obligation with ease (Holmes, G, Sugden A, Gee Paul 2008). Looking at the most liquid assets, where the cash and operating cash ratio we find that the company declined in the cash ratio but improved in the operating cash ratio. The cash ratio declined from times 2 to times 1.2 from year 2007 to year 2008 respectively. This ratio considers the ability of the firm to meet current obligations from the most liquid assets and the positions as depicted by these ratios shows that the firm is strong financially and can meet the short term obligations without technical default (Bernstein L ,1993). Cash from operations ratio indicate an improvement it shows that the performance of the company improved from times 0.78 to 1.1 in the year 2007 to year 2008. What it means is that the company improved its performance by generating cash that can meet current liabilities with ease (Bernstein L 1993). This is a positive move for this airline considering this was a period of the financial crisis. The trend of these liquidity ratios is shown by the chart below.
From the below chart we can note that all other ratios were on downward trend except the operating cash ratio. Operating cash ratio is the ratio which considers cash generated from the operations.

Profitability
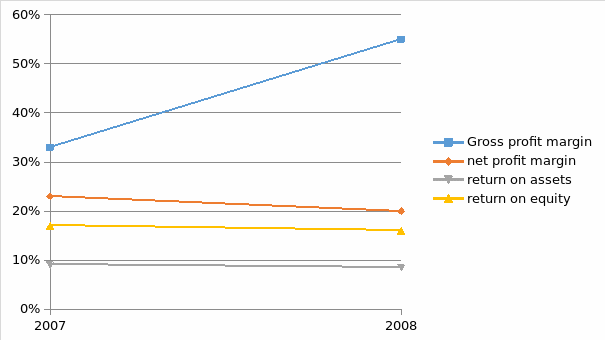
Looking at the profitability of this company one concludes that the profitability of the company did not improve overall although the gross profit margin improved. The decline in the profitability is attributed to the abnormal increase in selling abnormal increase which jumped from 71560 to 1,228,570. The Gross profit margin improved from 33% to 55%. While the net profit declined from 23% to 20%. The same trend is witnessed in the return on assets which declined from 9.1% to 8.5%. The return on equity also declined from 17% to 16% from year 2007 to 2006. Return on assets is used to measure the overall performance of the company. It shows that the assets were well covered by the return although it declined. The same ratio is used as the net profit ratio to measure the overall performance of the company (Bernstein L, 1993).
The two figures, return on assets and net profit ratios show that the performance decline. However these ratios cannot be used alone without the ratio of return on equity which is taken by investors as a good measure to estimate the performance of the firm. Although this ratio fails to measure the performance for other stakeholders it is good for a prospective investor. If this ratio is les than the cost of equity, then the firm will be destroying its value. In this case, it appears that the firm is performing exceptionally well (Bernstein L 1993). The trend taken by the profitability ratio of this firm is shown below by the chart.

Looking at the chart above one gets a mixed trend. The Gross Profit is showing an upward trend while the other ratios are showing a downward trend. However the other ratios have had a downward trend because of abnormal increase in general, selling and administrative expenses. However the financial performance is good although it declined.
Operational/efficiency ratio
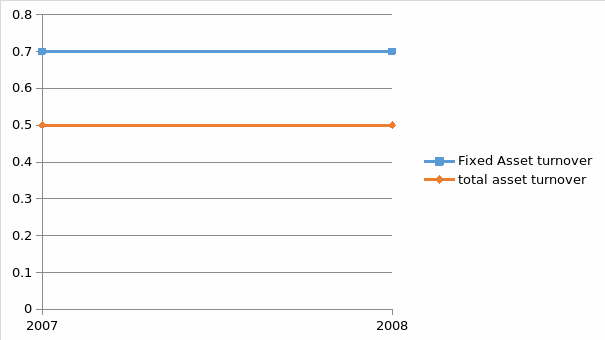
Asset management ratios used in this case are fixed assets turnover and total assets turnover ratios. This is because inventory turnover and receivable turnover cannot be applicable in this case because most of Transactions Company’s are in the service for this sector (Bernstein L 1993). They have very little stock and very little receivables. This ratio measures how efficient Ryanair was in utilizing its assets. It shows how the assets were used to generate revenue for the company (Bernstein L 1993). The assets turnover ratio indicates that during the two years it remained the same it never changed much. The same case is applicable to the total assets turnover. The total assets turnover remained times 0.5 for the two years and the fixed assets turnover remain times 0.7. it shows that for every dollar invested of fixed assets there was 0.7 dollars of revenue while every dollar of total assets invested there was 0.5 dollar of revenue generated. These two ratios will assist the company’s to come up with a pricing strategy that will improve profitability for the company (Britton, A. and C. Waterston 2004 and Beaver W. H, 1989). The trend taken by these two ratios is depicted in the chart prepared.

Solvency ratio
Solvency ratios measure the company ability to meet long term obligations and they form part of the capital structure. The ratios that have been calculated in this case include total liabilities to total assets interest coverage ratio and long term debt to equity (White G I Sondhi E C & Fried D 1999). The total liabilities to total assets remained the same for the two periods meaning that for every 0.6 dollars in debt there were one dollar of assets. it shows that the company’s has enough assets to cover total liabilities. However there was change in the long term debt to equity ratio. This ratio increased from 0.7:1 to 0.8:1 in the year 2007 to year 2008 respectively. This ratio shows that the company increased reliability on long term debt. Meaning that for every dollar of total equity there is 0.7 dollars for long term debt and it increased to 0.8 in the year 2008. This is the overall performance of the company in terms of solvency and the capital structure. However, interest coverage ratio which measures the ability of the firm to pay interest has shown a decrease also (Beaver W. H, 1989). This ratio has decreased from times 7.4 in the year 2007 to times 5.5 in the year 2008. Overall the solvency ratios show that the company is increasing its risk of liquidation that is the financial risk because these ratios have deteriorated.
Conclusion
From the above financial analysis, I will be persuaded to conclude that Ryanair holding is a profitable firm with a stable short term financial position and a good capital structure with an efficient management. This is so because the company has maintained positive ratios in areas of liquidity, profitability, solvency and efficiency. This conclusion is not only based on the above analysis but based on a number of factors especially the current financial crisis that has affected most operations, profitability, liquidity and solvency of many businesses (Collier, P. 2006 and Neely, A. Michel, P. and Martinez V. 2006).
I will recommend for any investor willing to put his money in the airline service sector to think of this company which has a strong financial base and performance. For those investors who have their shares of this company I will advice them to hold their shares because the performance looks good and this may be translated into a good price.
However the above conclusion and recommendation will be affected by the following limitations.
- I have relied on the financial statements up to 31st march 2008 and much has taken place in the stock market in the business place including the current stimulus package which is intended to boost the growth of the economy. There is no adjustment that has been made in inflation in the financial statement but has been left to their historical form.
- The current and long term prospects of the company have not been relied upon while making this recommendations therefore this ought to be considered in order for successive advice.
References
Altman (1993)E I corporate financial distress and bankruptcy, 2nd edition new York John welling and sons.
Beaver W. H (1989) Financial reporting: Accounting revolution, Englewood cleves, prentice hall.
Bernstein L (1993); financial statement analysis, 5th edition, Homewood, Irwin.
Britton, A. and C. Waterston (2004) Financial Accounting.
Collier, P. (2006); Accounting for managers: interpreting accounting information for decision making, Wiley.
Dyson, J. R., Accounting for Non- Accounting Students (2004), Pearson Education Ltd.
Glautier M W E & Underdown D (1977) accounting theory and practice pitman.
Holmes, G, Sugden A, Gee Paul (2008) Interpreting Company Reports and Accounts.
Neely, A. Michel, P. and V. Martinez (2006) Acting on information: performance management for the public sector London Advanced Institute of Management Research.
Reid, W. and D R Myddelton (2005) The meaning of company accounts, Gower Publishing Ltd.
Weygandt, J. Kieso D. and P. Kimmel (2005) Accounting principles, Wiley.
White G I Sondhi E C & Fried D (1999): The analysis and use of financial statements Wiley.

