Introduction
This paper seeks to study and follow the progress of the stock price of Marks & Spencer Group plc at the London Stock Exchange over a short period in relation to news development about the company. This paper will also study the external and internal environments of the company to be able to understand the behaviour of its stock price by evaluating the company’s financial performance, liquidity position and solvency in relation to its competitors in the industry.
Analysis and Discussion
Marks & Spencer, its address, share prices of the company over the past six months and compared to other companies and stock prices for the past few years
Marks and Spencer Group plc (or “Marks & Spencer”) is engaged in the retailing of food, clothing, and home products in the United Kingdom. As a group of companies, it has member companies or subsidiaries, which are primarily engaged in retailing, financial services, procurement, and property management as holding companies. It has its international segments or subsidiaries located in Hong Kong, Taiwan, Greece, Republic of Ireland, a number of Balkan stats and other countries in Eastern Europe (Marks and Spencer, 2009).
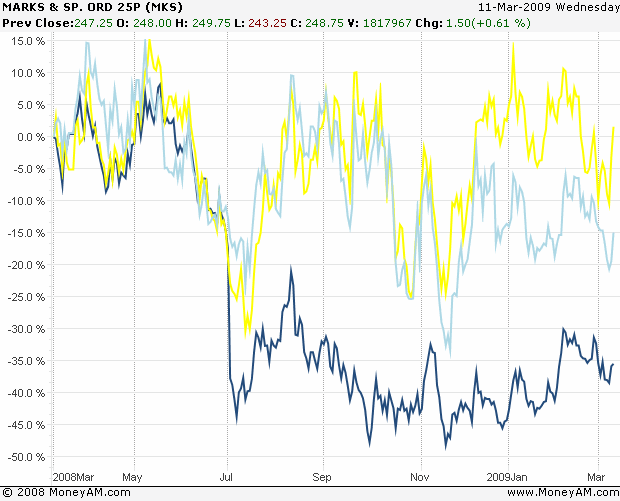
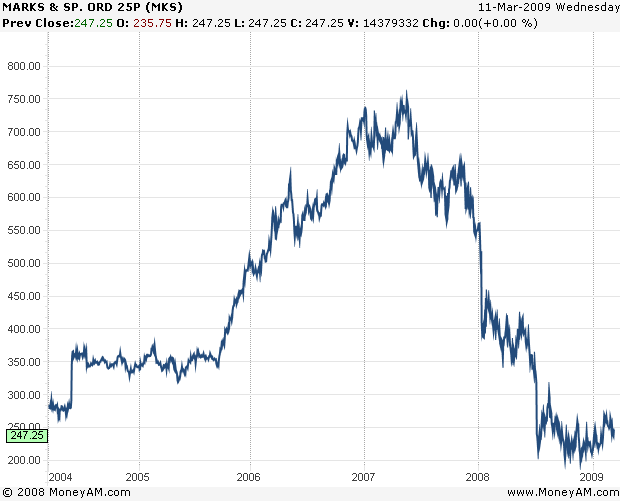
The share prices of the company in last few months compared with some competitors and the last few years can appreciated in separate stock price graphs for the past six months and past five years in Figures 1, 1A and 1B below:
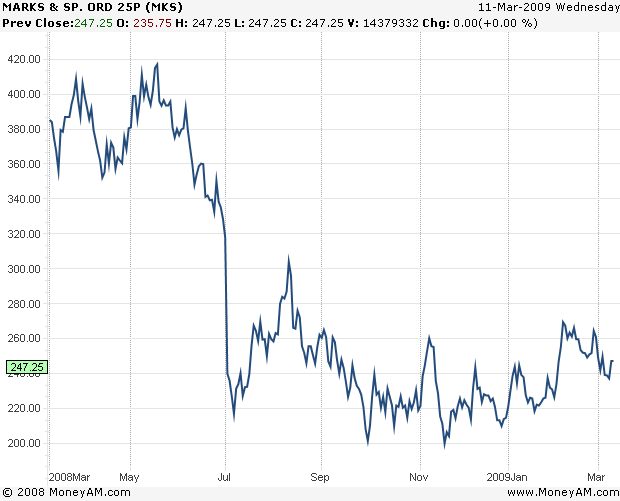
It may be observed that stock prices of the company for the last six months ending as of this writing show volatility with increases and decreases in short periods time but generally the declines in prices for the last six months period have only went down a little slower than its lowest point sometime in July 2008 when the fall was really steep from about 300 pence per share to about 210 per share. In fact, the prices of the past six months may be considered to have risen a little on the average from the lowest point in July 2008.
It may further observed in Figure 1A that Marks & Spencer has an inferior stock performance compared with competitors Kingfisher and Home Retail starting in July, 2008 while before the said date, the three companies were almost performing equally. This means that compared with competitors, Marks and Spencer appear to have deteriorated in the light of the recession not only in the UK but also in other parts of the world where it has business operations. In fact as of January 2009, the company has implemented several job cuts and offered big discounts in response to the less than favourable condition of the company’s pricing strategy in relation to the recession (Werdigier, 2009).
To understand share-prices behaviour of a company is a material thing for purposes investment as it could tell how much investors are earning or losing in their investments. The same behaviour also affects how these investors to decide with their investment in Marks and Spencer. Share-prices behaviour reflects the reactions or sentiments of the investors in relation on how they perceive the value of the company.
Since events and news affecting the company could be either external or internal, this paper will discuss both. In discussing the internal factors affecting the company, this researcher uses the company’s annual report for that fast few years to understand any relation of its performance of its stock price. Normally companies are evaluated in terms of profitability, efficiency, liquidity and solvency in relation to other companies in the same industry. By comparing the company’s financial ratios with its competitors, this paper in effect studies as well as the external environment of the company. This part of the paper therefore combines the two kinds of analysis for the purposes of coming up with an explanation on what is happening in the stock price of Marks & Spencer.
Financial Analysis
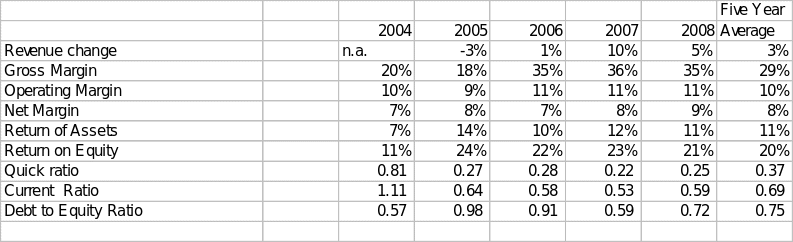
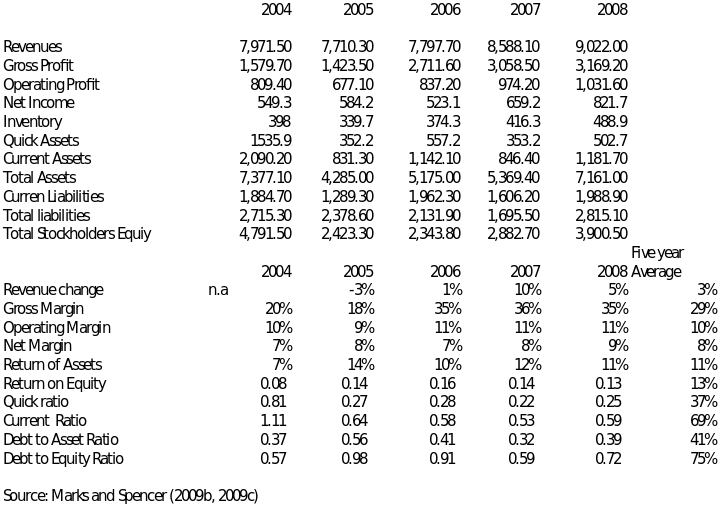
To get an immediate picture of how well the company is doing in terms of its finances necessitate a financial analysis by using its financial ratios as summarized in Table A below. This part is segmented into profitability and efficiency, liquidity and solvency analysis.
Profitability and Efficiency
The company’s returns on equity (ROEs) for the past five years show general profitable performance. From 2005 to 2008, said ROEs were consistently high although with some fluctuations, averaged at 20% for the past five years. Please refer to Table A.
To have 11% to 23% return on equity signifies that investors could expect returns of about £11 to £23 for every £100 investment. The ratios are very attractive to investors as could be viewed as something high for a company like Marks and Spencer. It is better than competitor performance in the retail industry and even other industries is best proved by its very latest twelve-month ROE of 34.2% as against S&P index of 27.8% (MSN, 2009).
Further comparison with a Bank of England base rate of 0.5% (Housepricecrash, 2008) as an estimate of rate of money that invested in a risk free rate investment like a treasury bill, the company’s profitability in terms of latest ROE is demonstratively illustrated. This amounts to a finding of ROE of more than five times the risk free rate; hence it should be an investment that is very difficult to find and very attractive to investors.
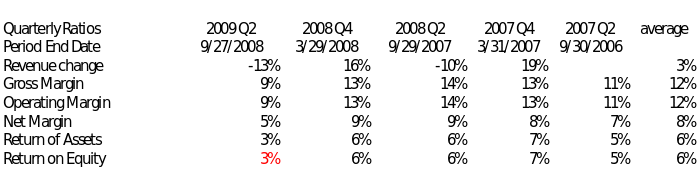
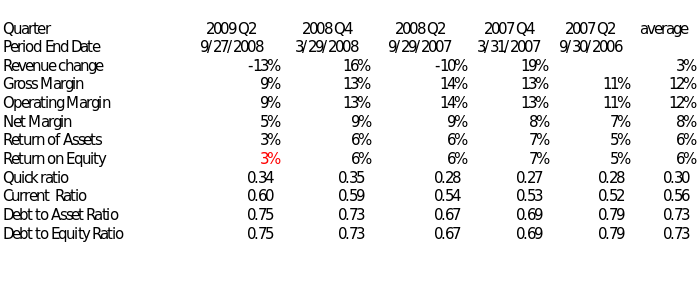
However, short-term fluctuation in its stock price may have been caused by the volatility of earnings in the short-term earnings or profitability. Based on the latest available financial information as of September 2008, about the company, it can be observed that the average ROE for the years 2004 through 2008, has somewhat declined to about 3% which is an indication that the company’s profitability on a quarterly basis has substantially declined (MSN, 2009b). Please refer to Figure 1 in relation to Appendix A1.
Its profitability appears supported also by its operational efficiency. Its operating margin averaged 10% for the last five year. If compared with its net profit margins for the last five years, which registered an average 8%, the company may be considered realizing much from its low level of expense in relation to revenues. Please refer to Table A above.
Its operating margin is the computed margin after deducting cost of sales or services and operating expenses. Add or deduct other income(s) or other expenses and net income is derived. Marks and Spencer’ management appears to be supported well by its employees in delivering value to customers, thus its efficiency is understandable.
The company’ combined profitability ratios in terms return to equity, operating profit margin and net profit margin may explain the relatively good price of its stocks compared to other companies in the stock market. A valuation would be needed to apply financial information in estimating the intrinsic value of the company’s stock (Ross et. Al, 1996).
Liquidity
Liquidity ratio is needed for company as a way to know whether it is able to meet a company’s currently maturing obligations. It is normally measured using the current ratio and the quick asset ratio. As applied now, the current ratios of Marks and Spencer averaged at 0.69 while its quick asset ratios for same years averaged at 0.37. Refer to Table A above. Both ratios indicated no clear trends due to fluctuations for the years under study and they ratios could indicate low liquidity. While profitability should have generated funds to increase liquidity level, its is rather surprising for the company since it could mean that the company’s profitable operation has not resulted in higher funds to pay creditors.
Further liquidity analysis show that its current ratios are in fact lower than quick ratios where both averaged below 1.0. This would mean the company is using so many funds for other purposes including payment of dividends, which could be a way to prioritize solvency as would be discussed in the next sub-section. Compared with industry average current ratio of 1.4 and quick ratio of 1.02 respectively as represented by S & P Index, five-year average current ratio of 0.69 and quick ratio 0.37 respectively for Marks and Spencer are clearly inferior.
Solvency
While liquidity assures the short-term, solvency on the other hand assures the company’s long-term capacity to keep up it stability over the long term. Debt to equity ratio or solvency ratio is computed by having the total debt of the company divided by its total equity. Said solvency ratio guides investors that a company needs to have a long life to recover long-term investments by producing the needed returns in a number of years. The debt to equity ratios of Marks and Spencer averaged at 0.75 for that past five years. Please refer to Table A above. The ratios are quite low since not a single year ratio has reached 1.0, which indicates the company’s investment from stockholders can surely cover what it borrows or that there is less amount of debts in relation to its equity.
It can be examined that the changes in the ratios showed improvement from 2005 to 2006 and from 2006 to 2007 while deteriorations were obvious from 2004 to 2005 and from 2007 to 2008. Such changes could be attributed to changing level of profitability of Marks and Spencer. As an overall assessment however, the company may still be considered solvent and therefore still possessing good long-term health as justified by its continued profitability from 2004 through 2008. However, the notable continued decline in liquidity position was a forced consequence of prioritizing its solvency position. Not surprisingly, the company has been able to provide consistently its stockholders with good dividends but the same is causing a problem in its liquidity position.
Compared with industry average debt to equity of 1.02 as represented by S & P Index, average debt to equity for Marks and Spencer is better at average of 0.75. This means that the company is more stable than its other competitors in the retail industry.
Member companies and/or subsidiaries of Marks & Spencer Group
The member companies and/or subsidiaries of Marks & Spencer Group plc include companies that perform the principal activities of retailing, financial services, procurement, and property investment and as holding company. Those similarly engaged with retailing as the mother company include Marks and Spencer (Ireland), Marks and Spencer (Hong Kong), Marks, and Spencer Marinopoulos Greece SA.
Those engaged in financial services include Marks, Spencer Investment Limited, Marks, and Spencer Finance plc, which are both in Britain. Those in procurement as principal activity include Marks and Spencer SCM Limited and Per Una Group Limited, both of them are incorporated in Great Britain. Those in property investment as principal activity include Marks and Spencer Chester Limited and Marks and Spencer Scottish Limited Partnership, both got incorporated in Great Britain. As holding company, Marks and Spencer International Holding in Great Britain is part of the subsidiaries (Marks and Spencer, 2009b).
The share capital of Marks and Spencer
From the company’s latest financial statement, the composition of its share capital is as follows: The authorized or nominal capital as of 2008 is £800 million or 3.2 billion shares at 25p per each (Marks and Spencer, 2009b).
It is reserved capital, issued and fully subscribed and paid as of 2008 has a nominal value of £396.6 million representing 1.586 billion shares fully paid at 25p each (Marks and Spencer, 2009b).
The unissued capital as of 2008 represents the difference of L403.4 million representing about 1.614 billion shares (Marks and Spencer, 2009b).
The valuation of the company’s stock using certain models
The company’s stock price is normally affected by the events happening in the company and how investors perceive about these effects in terms of the risks and return of their investments in the company. Some of the events that may affect the company include news on closing of stores as reaction of the recession that started last year not only in UK but in all other areas where the company has its business operations are affected. It may be recalled that the company has subsidiaries in different countries and the financial performance of these subsidiaries would have to be reflected in the company’s performance of its stock as one consisting as a group of companies.
As stated earlier, the historical financial report may provide and indication of how the company will perform in the future to justify investments made in the company. This part however will also look into possible overvaluation or undervaluation of its stocks using estimates of future dividends as discounted using the company’s cost of capital.
Cost of capital calculation for Marks & Spencer.
In valuing the stocks of Marks & Spencer, this researcher uses the company’s cost of capital. The said cost of capital approximates the concept of opportunity cost as used economics to guide investors if earnings are justified or not. Generally, earnings should be above opportunity cost or cost of doing business. It is therefore desirable to have lower cost of capital to have higher advantage. The same cost of capital will be used as discount rate in discounting dividends under the dividend discount model as way to determine the intrinsic value of the company’s stocks.
The capital asset pricing model (CAPM) is used to approximate the said cost of capital (Van Horne, 1992). CAPM could illustrate how risk and expected return are related and balanced against each other and how investors use it to price securities especially if these are risky ones.
The CAPM formula is: Required (or expected) Return = RF Rate + (Beta * (Market Return – RF Rate)). RF represents risk free rate and can be approximated for the purpose of this paper a Treasury bill rate using as an approximate basis the Bank of England base rate of 0.5% (Housepricecrash, 2008). Risk free rate means that doing nothing except to wait; the investor earns interest from his or her investment from treasury bills. The same investor does not need to worry because the money invested will surely earn interest after a period because the government is the guarantor.
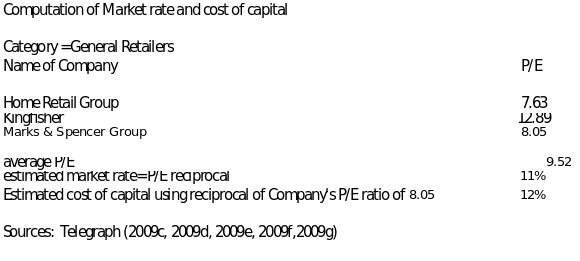
The beta measures of market risk, which is the extent to which the returns on a given stock, such as that of Marks and Spencer in this particular case, move with the stock market. To apply the same, the current risk free-rate at 0.5 % and the market is expected to produce return of 11% next year. The later rate is derived by taking the average market rates of the competitors in the industry including that of Marks & Spencer. See Appendix B. The Company’s beta is 0.72 (Telegraph Group Limited, 2009a). Applying the formula would show that Marks and Spencer would have an estimated cost capital of 0.93% as computed below:
Required (or expected) Return = RF Rate + Beta (Market Return – RF Rate)
0.50% + ((11%- 0.50%)*0.72) = 0.93 %
CAPM shows that Marks & Spencer has a required rate of return of 0.93%, which must be earned by someone who plans to invest in the stock of the company. Failure to earn a minimum of this return indicates poor financial management judgment since such investor appears not to know how much should be earned. Returns below the cost of capital should warn a stockholder to think of disposing one’s stock holdings from the company in order to prevent further losses.
An alternative way to estimate the cost of capital is to get the reciprocal of the price of the company’s price earnings ratio. The P/E ratio gets computed by dividing the market value per share of stock by the earning per share and indicates the willingness of investors to buy a share of stock for every level of earning per share in companies. Using the reciprocal of the P/E ratio may also produce an estimated cost of capital of 12.0%, which is computed by dividing 1 by P/E ratio of 8.05 (See Appendix B).
Market value of the company as computed using cost of capital as discount rates
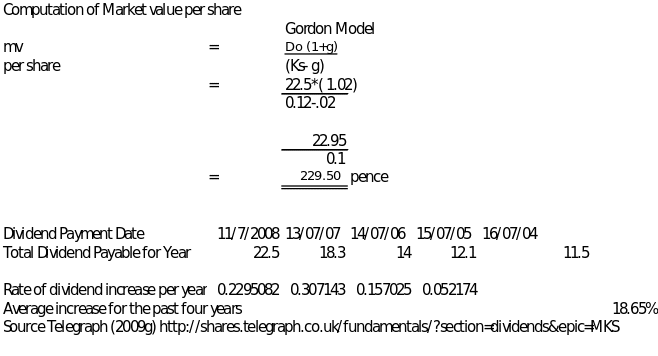
The market value of 229.50p per using the constant growth model is determined by using an assumed growth rate of the dividend per share of 2% per year as computed together cost of capital estimated at 12% using the P/E reciprocal of Marks and Spencer. See Appendix C.
The market value is derived in combining the following information: Dividend last year D0, expected growth rate in dividends (g), and the discount rate. The dividend per share paid last year (2008) is given at £22.5p while the expected growth rate was calculated by taking the average growth rate the dividend per shares for the prior years computed at 18.65% (Appendix C), while the discount factor used is 12% as computed using P/E reciprocal of Marks and Spencer. To use the rate of 0.93% using CAPM would make it more improbable to use the dividend discount model as the computed growth rate of dividend is very high at 18.65%.
To allow working of the dividend discount model, a rate lower than discount rate of 12% is assumed. The resulting stock valuation assuming the dividend growth rate was brought down from 18.65% to 2% would be would be 229.50p per share. Under this assumption, the resulting value is not far from the current price of 247.25p (Telegraph Group Limited, 2008d). Since the computed dividend growth rate was very high it would mean than the present price could be undervalued using the dividend discount model.
Identify the employability skills (at least 5) you have used in carrying out this project. For each skill you identify, provide brief evidence of how you have applied it in the project
The employability skills used by this researcher in carrying out this project include analysis, synthesis, ability to relate theory with practice, ability to link the meaning of figures and graphs for better understanding and the ability to organize and power to present information convincingly. Each is explained below for clarity.
Analysis. This paper has required this researcher to understand the implication of the figures by computing the financial ratios and from the financial ratios, the meaning of the same must be analyzed in relation to the stock price behaviour. The conclusions are the best proof of this skill.
Synthesis. After the analysis of each, this research has in effect applied synthesis by combining all the resulting ratios to give a combined significant to the situation of the company’s stocks and for the purpose of making conclusion and recommendations.
Ability to relate theory and principles of accounting with a real company. This researcher made some readings on financial ratio theories before making proper understanding and application of the same to real company like Marks and Spencer. This paper is the best proof of the theory application made.
Ability to give meaning to graphs and figures. It is said the presenting ideas takes many forms. Although this researcher believes some ratio computations were already made, the understanding for other audiences or readers would be enhanced by putting some figures and ratios in the form of graphs. Graphs can be found in the appendices and Figures 1, 1A and IB in the text.
The ability to organize and power to present information convincingly. An idea is only as good as many will believe its benefits. This researcher believes that self-conviction is attained on the rationality and organization of what have been done. It is further believed that some readers of this report would also be convinced as reasons used logical and verifiable. This researcher has used premises based on facts from the annual report and the conclusion follows the principles of logical reasoning.
Finally predict the future direction of the stock market and what you would recommend to potential investors in your chosen company and the stock market generally
This researcher predicts that the direction of the stock market in the near future would be to go down first and then eventually go up again. This is because the company’s stock price was very high having reached a peak point sometime in 2007 at more than 700 pence per share. I believe at the present price of about 250 pence per share, the prices could bounce back again in the future since the company has effectively responded with what is happening in the world economy. Marks and Spencer may have reduced some its business activities by closing some of its stores but eventually when recession stops or when recovery in the economy sets in higher prices would be back. This must be so also since despite the present crisis, the company has managed to show profitability compared with many companies in other industries.
Conclusion
It can be concluded that company’s current stock price of 247.25 pence share (Telegraph Group Limited, 2009) is undervalued if the actual dividend growth would possibly be used. But since the rate was brought down to 2%, it would appear that the valuation is almost as close to the stock price as London Stock Exchange. Undervalued stocks means that buying company’s stock at present price may be advised to bought since price of the said stock could really go up in the future. This would confirm that said stock price could go back to above 700p per share as was recorded in 2007 before the big fall in the prices when the effect the recession was felt by the company.
The possible price increase however depends on whether recession would cease soon. If not the computed price may not fully reflect the value of the company’s stock using the dividend discount model which assumes that growth rate in dividend would continued as in the past. This paper’s recommendation for possible investment with Marks & Spencer’s stocks materially depends also, on whether the economy would fare better soon.
Appendices
Appendix B
Appendix C
References
Housepricecrash (2009) UK base rate. Web.
Mark and Spencer (2009a). Web
Mark and Spencer (2009b), Mark and Spencer 2008 Annual Report. Web
Marks and Spencer (2009c), Marks and Spencer Financial Information. Web.
MSN (2009), Profitability ratios of companies under the S&P 500 Index. Web.
MSN (2009a), Financial Condition Ratios. Web.
MSN (2009b), Latest quarterly comparison for Marks and Spencer. Web.
Ross et. al (1996) Essentials of Corporate Finance, IRWIN, London, UK.
Telegraph Group Limited (2009a), Stock price graph of Marks and Spencer only – six months. Web.
Telegraph Group Limited (2009b), Stock price of Marks and Spencer compared with Kingfisher and Home Mutual Group – six months. Web.
Telegraph Group Limited (2009c), Stock price of Marks and Spencer only – past five years. Web.
Telegraph Group Limited (2009d), Home Retail Group plc Financial Information. Web.
Telegraph Group Limited (2009e), Kingfisher plc Financial Information. Web.
Telegraph Group Limited (2009f), Marks and Spencer Financial Information. Web.
Telegraph Group Limited (2009g), Marks and Spencer dividend payments. Web.
Van Horne (1992) Financial Management and Policy, Prentice-Hall International, London, USA.
Werdigier, J. (2009), Marks & Spencer Plans Job Cuts and Closings, New York Times. Web.