Introduction
This paper would compare and analyze the two large companies DHL and FedEx to recommend the prospect of these organizations. Both organizations are well defined with their structure and strategy to achieve their vision statement with the skill of the management and workforce. This report evaluates the TOWS Matrix of DHL and FedEx to discuss the internal and external environments. Moreover, it should consider competitive analyses by using porter’s five forces and illustrates three strategies that have contributed to the company’s success, growth, cost reduction, product, etc. To advise venture capitalists, would measure the performance of these companies and help to conclude. However, to do so this paper would calculate three years revenue, net income, and stock price for the year 2008 for both companies and then contrast each other to draw a conclusion which company DHL or FedEx would be preferred by venture capitalists for investment.
Company Overview of FedEx
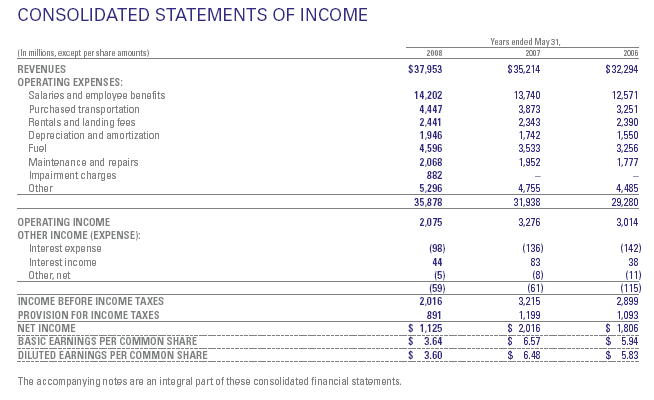
The well-established global logistic service company FedEx Corporation is also known as FDX Corporation, which has formed in the United States in 1978. FedEx Corporation has more than 290,000 employees and $ 24.6 billion in market capitalization. In 2008, its revenue was US$ 35.50 billion and its earning per share today is 0.314. According to the annual report 2008, it has several sub-brands such as FedEx Express, FedEx Ground, FedEx Freight, and these sub-brands have different business activities. The service of FedEx extended from delivering mail to transport sectors, global logistic service, e-procurement, and e-commerce and supply chain.
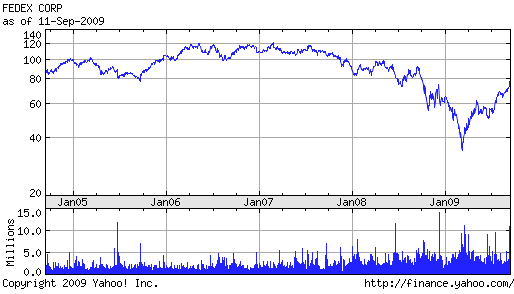
The above basic chart of FedEx Corporation shows that in the first quarter of the fiscal year 2009, its share price was the lowest position but after that, it is increasing. From this chart, it can assume that their strategy is working but this paper would prove this truth mathematically.
Background of DHL Worldwide Express
The market leader DHL Worldwide Express has started its operation in 1969 and it has continued to expand at a phenomenal rate. It can provide service in every corner of the world as it has 300,000 employees in 220 countries. The major issues of its success are international network links, gradually reaching out to new customers, the initial data sharing and assessment, IT synergies, and alignment, long-term IT strategy, unparalleled expertise in express, air, and ocean freight, delivering excellent service for customers.
Other important factors of its success are it always offers new services, team management system to serve the best service, reflection of positive media coverage, constructive feedback from customers, merger, and acquisition with large companies and it has a complete in-house transport offering from its brands. According to the annual report 2008, DHL has mainly five sub-brands, such as ‘DHL Express, DHL Freight, DHL Supply Chain/CIS, DHL Global Forwarding/freight, DHL Global Mail, and the Exel brand has used for North American Contract Logistics business (DHL Press, 84).
Financial Analysis of Deutsche Post World Net
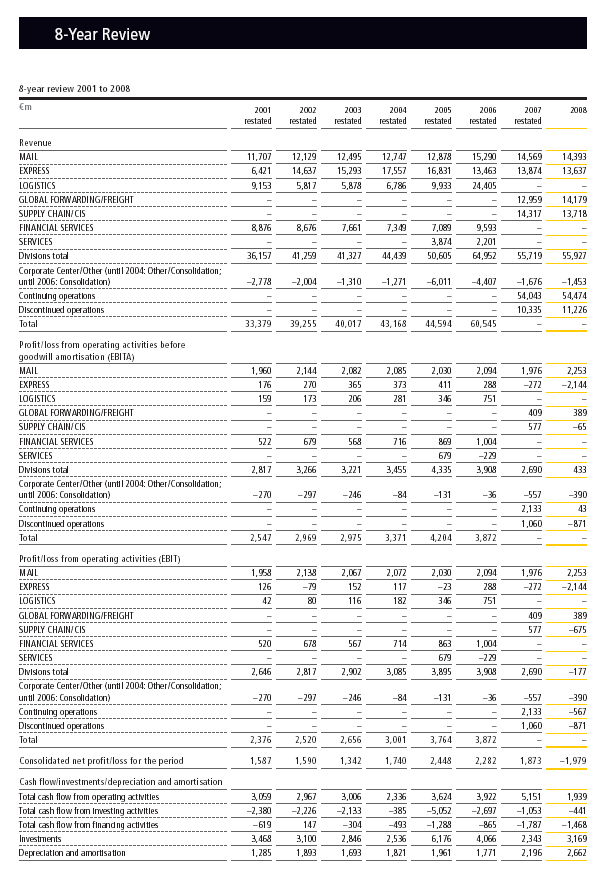
- Three-year revenues: Following table presents the Calculation of revenues for the financial year 2006, 2007 and 2008 respectively. (Annual Report 2008, pp. 2, 127, 131, 211)
- Net income: Estimation of net income for 2006, 2007, and 2008 (Annual Report 2008, pp. 2, 211, 212)
- Stock price: Table below presents the calculation of stock price for the corresponding three years (Annual Report 2008, pp. 39, 212)
Financial Analysis of FedEx
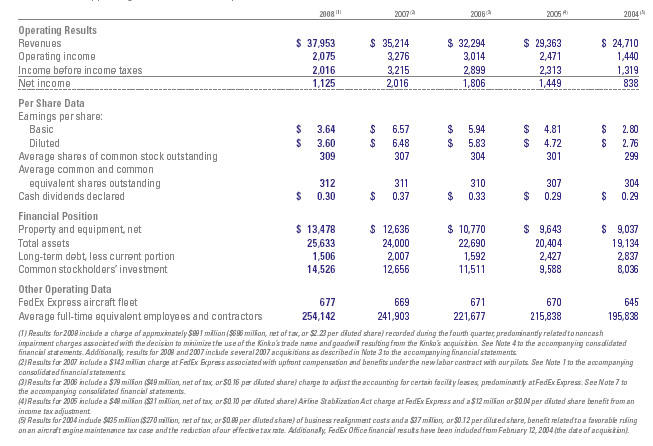
- Three year revenues: Table of revenues for respective three years (FedEx Company Profile, 5 and FedEx Annual Report, 12)
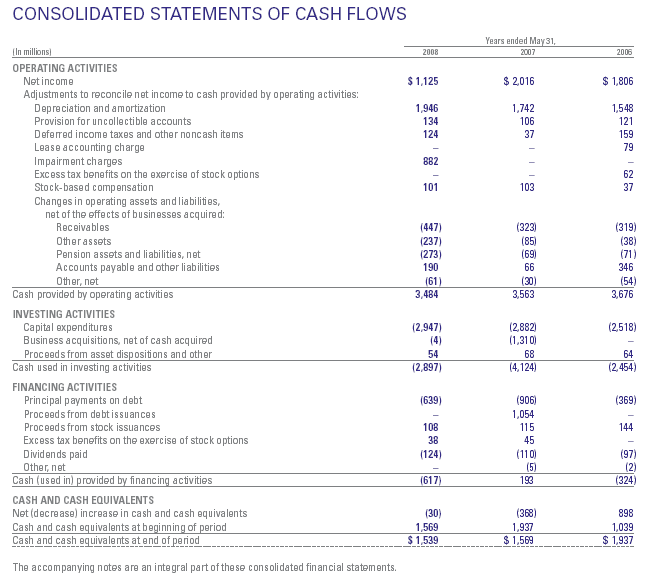
- Net income: Measures of Net Income corresponding three years (FedEx Annual Report, 2008, pp.12, 45, 56, 70).
- Stock price: computation of stock price for subsequent three years (FedEx Annual Report, 2008, pp. 12, 30, 59).
- Comparison between Deutsche Post World Net and FedEx: Investment decision making requires employment of three essential tools- payback period (PBP), net present value (NPV) and internal rate of return (IRR). Calculations of each force are plotted sequentially bellow for both of the companies for the year 2008.
TOWS Matrix for DHL
The following table illustrates the TOWS Matrix with appropriate strategies for DHL Worldwide Express:
TOWS Matrix for FedEx
Competitive analyses- Porter’s Five Forces Model
Porter five forces analysis facilitates the vendors to differentiate as a ready for action environment. The following figure demonstrates the features, which influencing industry competitors, for example, here for both companies, prices are comparatively high for brand awareness of DHL and FedEx, so bargaining power of buyers is high. However, threat of substitute and threat of new entrants are low as the market is declining due to global financial crisis but both companies are anxious for competitors.
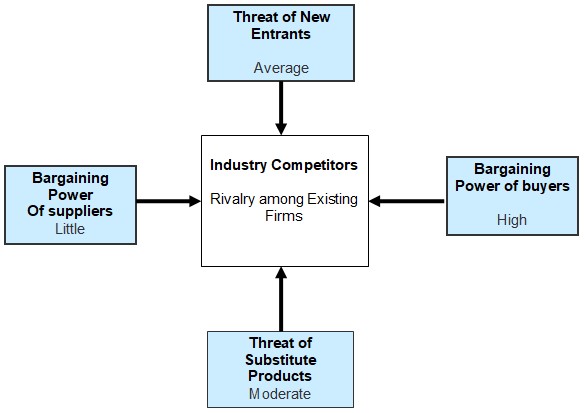
The threat of entry
Though theoretically new substitute service providers can enter in the market at any time but practically the threat of potential entrants is low for both DHL and FedEx because for the global financial downturn, airlines industry, mail industry and transport industry have seriously injured with continuous losses, so, investors will not invest for new companies. Moreover, new companies should require more extremely large capital that negates the threat new entrants these companies.
The power of buyers
Customers who want quick and secure service, they choose large companies for their requirement and both FedEx and DHL are the right choice for customers. Different types of customers have different preferences for their service and FedEx and DHL has designed the service according to customer demand so the companies are cost effective. Between these two companies, DHL is the customer’s first choice all over the world because of its strategy such as all business units and employees have separate responsibilities to satisfy customer’s demand.
The power of suppliers
According to Porter, the powers of suppliers have a propensity to be a turnaround of the power of buyers. For DHL, the power of suppliers is lower as supplier contracts entered into by group companies and DHL believes the team works together with suppliers. On the other hand, FedEx considers that in the competitive environment the suppliers are a great source of trust, dependability, and confidence.
The threat of substitutes
Generally, the substitute service is come from different competitors but FedEx has no particular strategy to differentiate its services from the rivals. However, the parcel and transport industry is so competitive that DHL find outs the possible substitute products and services. For example, day-to-day traditional mail has replaced by the email, fax service, and mobile phone.
Competitive Rivalry
The main competitors of FedEx are United Parcel Service (UPS), DHL, TNT and Air Delivery & Freight, which holds the more strong position in US market. UPS has more than 426,000 employees, and $ 58.86 billion market capital, on the other hand, Fedex has only 212,700 employees. However, the relationship with the competitors is not rivalry, so Fedex should more conscious about the competitor’s strategy. Like FedEx, DHL is also facing competitive rivalry. The competitive nature of the market makes this as a natural phenomenon. However, DHL is a part of Deutsche Post World Net, which is the market leader of world market, so the rivalry cannot affect the basic objectives.
Marketing Strategies of DHL
- Cooperative Strategies: DHL has numerous strategic options but from very begging this company would like to follow cooperative strategies such as
- According to the Annual report 2008 of DHL, it formulates partnership with Airbus through a mutual interest of resources and capabilities;
- Joint venture can promote a new venture with other by amalgamation of their resources, for example, DHL Express extended its joint effort with Luft hansa Cargo and formed a new brand AeroLogic.
- International Strategy: International strategy is important for DHL because it has worldwide operation.
- Business Level Strategy: Business level strategy provides the opportunity to find DHL’s industry situation in relation with other rivals as it has been indicated as market leader in the world focusing on 10% growth rate annually.
However, to overcome global financial crisis it has several strategies such as maintaining leading position in the international express market, concentrating on the international express business in the USA, increasing presence in growth markets, managing global network costs such as it use Boeing 777 to optimise fuel consumption and decrease our per-unit costs (Annual report, 62).
Marketing Strategies of FedEx
- Global Strategy: According to the annual report 2008, it would like to maintain global strategy though it has many challenges such as rapidly rising fuel prices.
- Acquisition and restructuring strategies: Besides global strategy, acquisition and restructuring strategies are playing vital role for instance In 2007 FedEx Corporation has acquired a freight operator LTL of Watkins Motor Lines as well as formed several strategic acquisitions with Chinese, Indian and British companies and so on.
- The Investment strategy: The management strategy of FedEx is depends on the investment strategy, for example, capital investment, spending capital investment, allocation of share and pension funds, and evaluation of cash flow statement depend on this strategy.
Deutsche Post World Net
- Pay back period (PBP), (Annual Report 2008, pp. 2, 211, 212): Pay back period = [A + (NCO – C) / D]
Where; NCO = Net Cash Outlay or Initial investment = € 3,169 million
A = Year which is nearest of Cumulative CFAT = First year
C = Cumulative CFAT of the year A = € 2,282 million
D = CFAT after year A = € 1,873 million
CFAT = Cash flow after tax
Pay back period = [A + (NCO – C) / D]
= [1 + (3,169 – 2,282)/ 1,873]
= 1.474 years
Workings:
Calculation table of cumulative CFAT-
- Net present value (NPV), (Annual Report 2008, pp. 2, 39, 211, 212): NPV calculation table-
Workings:
Discounted CFAT, PV = FV / (1 + i) ^n
Where; PV = Present Value
FV = Face Value = CFAT for the following year
i = Interest rate = 8.5 % or 0.085
n = Number of Years = 3 years 2006, 2007 and 2008
NCO = Net cash outlay or Initial investment = € 3,169 million
NPV = (∑ Discounted CFAT – NCO)
= (2,144.880431–3,169)
= − 1,024.119569
NPV = − € 1,024.119569 million
- Internal rate of return (IRR), (Deutsche Post World Net Annual Report 2008, pp. 2,): IRR = LDR + [{NPV of LDR / (NPV of LDR – NPV of HDR)} x (HDR – LDR)]
Where; LDR = Lower Discount Rate for positive NPV = − 51.5 % or − 0.515
NPV of LDR = € 1,793.157517 million
HDR = Higher Discount Rate for negative NPV = 8.5 % or 0.085
NPV of HDR = − € 1,024.119569 million
IRR = LDR + [{NPV of LDR / (NPV of LDR – NPV of HDR)} x (HDR – LDR)]
= − 0.515 + [{1,793.157517 / (1,793.157517 + 1,024.119569)} x (− 0.515 − 0.085)]}
= − 0.433391619
= − 43.3391619 %
Workings:
Calculation for positive NPV at discount rate − 51.5 % or − 0.515
NPV = (∑ Discounted CFAT – NCO)
= (4, 962.157517– 3,169)
= 1,793.157517
NPV = € 1,793.157517 million
FedEx Corporation
- Pay back period (PBP), (FedEx Annual Report, 2008, pp. 12, 45, 56): Pay back period = [A + (NCO – C) / D]
Where; NCO = Net Cash Outlay or Initial investment
A = Year which is nearest of Cumulative CFAT
C = Cumulative CFAT of the year A
D = CFAT after year A
CFAT = Cash flow after tax
Calculation table of CFAT-
Here; NCO = Net Cash Outlay or Initial investment = $ 2,075 million
A = Year which is nearest of Cumulative CFAT = First year
C = Cumulative CFAT of the year A = $ 1,086 million
D = CFAT after year A = $ 2,016 million
Pay back period = [A + (NCO – C) / D]
= [1 + (2,075 – 2,016)/ 1,086]
= 1.054 years
- Net present value (NPV), (FedEx Annual Report, 2008, pp. 12, 45, 56, 68, 74): NPV = ∑ Discounted CFAT – NCO
Net Present Value (NPV) calculation table-
Workings:
Discounted CFAT, PV = FV / (1 + i) ^n
Where; PV = Present Value
FV = Face Value = CFAT for the following year
i = Discount rate = 5.91%, 6.01% and 6.96% respectively for 2006, 2007 and 2008
n = Number of Years = 3 years 2006, 2007 and 2008
NCO = Net cash outlay or Initial investment = $ 2,075 million
NPV = (∑ Discounted CFAT – NCO)
= (3,738.65905 – 2,075)
= 1,663.659051
NPV = $ 1,663.659051 million
- Internal rate of return (IRR), (FedEx Annual Report, 2008, pp. 12, 45, 56, 68, 74): IRR = LDR + [{NPV of LDR / (NPV of LDR – NPV of HDR)} x (HDR – LDR)]
Where; LDR = Lower Discount Rate for positive NPV 2008 = 6.96 % or 0.0696
NPV of LDR = $ 1,663.659051 million
HDR = Higher Discount Rate for negative NPV = 46.96 % or 0.4696
NPV of HDR = − $ 48.1207777 million
IRR = LDR + [{NPV of LDR / (NPV of LDR – NPV of HDR)} x (HDR – LDR)]
= 0.0696 + [{1,663.659051/ (1,663.659051+48.120778)} x (0.4696 − 0.0696)
= 0.458355381
= 45.8355381 %
IRR = 45.8355381 %
Workings:
Calculation for negative NPV at discount rate 46.96 % or 0.4696
NPV = (∑ Discounted CFAT – NCO)
= (2026.879222 – 2,075)
= − 48.1207777
NPV = − $ 48.1207777 million
Investment decision
Following is the comparison table of the Deutsche Post World Net and the FedEx based on previously mentioned calculation of pay back period (PBP), Net Present Value (NPV) and Internal rate of return (IRR).
Figure, Source: Deutsche Post World and Net FedEx, Sheet 1Taking into account all the approaches of investment decision making- Pay back period (PBP), Net Present Value (NPV) and Internal rate of return (IRR) affiliated with a graphical presentation implicit result shows that all of the cases, performance of the FedEx is better than the Deutsche Post World Net. Furthermore, stock price and net income of the Deutsche Post World Net is lower than the FedEx though Deutsche Post World Net paid larger dividend than the FedEx. Support of the three comparison tools of investment decision making it would be smart and wise decision to invest in the FedEx due to their stronger financial position both in consumer market over and above in the stock market.
Challenges and learning for FedEx & DHL
In order to overcome global challenges, DHL has changed its technology, strategy and management policy. The global economic downturn brings on going business loss for DHL and FedEx, which declining profits of the companies. From 2008, changing the strategic management considering internal and external environment is the biggest challenge for these two companies. DHL has tried to generate more capital by lessening the operating cost, setting strict standards for investments, and restructuring the strategies. Besides DHL, FedEx is also fixing new strategies to increase the shipment and other trading volumes.
In recession, competitors are the main challenges for DHL as the interest rate of return is lower than FedEx and other competitors. On the other hand, net income and fixed asset of FedEx is smaller than DHL, however, DHL has seriously injured for the impact of global financial crisis. As a result, competitors become the great challenge for DHL and to save the company from further loss, it should take immediate initiatives.
However, FedEx has few challenges like they provide little attention on new customers, have less ability to change business environment, enlarging competitor’s market share, has no strategy for substitute products, and global recession.
Works Cited
DHL Press. Annual Report 2008 of Deutsche Post World Net. 2008. Deutsche Post World Net.
FedEx Corporation. Annual report 2008 of FedEx. Web.
FedEx Corporation. Company Profile of FedEx. Web.
Hitt, Michael, Duane Ireland and Robert Hoskisson. Strategic Management: Competitiveness and Globalization: Concepts & Cases, 8th ed. McGraw Hill, 2007. Google Books.
Porter, Michael, Competitive Strategy, 3rd ed. New York: The Free Press, 2004.
Weihrich Heinz. “The TOWS Matrix — A Tool for Situational Analysis”, University of San Francisco. 2008. CA 94117.
Yahoo Finance, Currencies Center. Web.
Appendix
Deutsche Post World Net
FedEx Corporation