Introduction
The structure and the strategic decisions of the modern business organisations are well established and particularly defined to achieve their vision with skill management teams. Nowadays, organisations are much more aware to comply with the combined code, rules and regulation, ethics and corporate social responsibility as a part of their operation. To analyses an authentic business organisation, this paper would go for Pilgrim’s Pride Corporation. The case analysis of PPC (Pilgrim’s Pride Corporation) begins with the background of the company with a detailed strategic analysis of the corporation based on its current financial situation.
The company profile shows that PPC has established 63 years back as a single feed store in a small East Texas dealing with poultry industries, which is now a multinational company operating in more than 80 countries with fifty fields of operation including chicken strips on a salad, or chicken breast sandwich, good taste or healthy food and Deli & Salads. This report would focus on a number of major points regarding the external and internal environments, missions, strategic visions, business objects, strategies, and several matrixes to analysis the market position in global recession. In order to draw key recommendations, this paper would consider financial ratios such as it would discuss liquidity ratios, profitability ratios, activity ratios, capital structure and capital market ratios.
Organisational Background
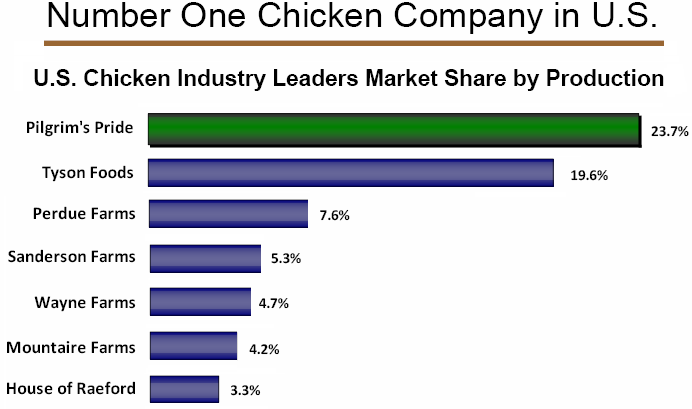
The Pilgrim’s Pride has established in 1946 when Aubrey Pilgrim and his friend purchased a feed & seed store with $3,500 purchase price where only 100 chickens were available for sale everyday but its annual net sales now is more than $8.5 billion and it is able to processes almost 45 million birds each week. PPC is the leading provider poultry products for customers, it is presently ranked No. 304 among 500 US largest companies because it has produced healthy, high quality food products (it produces above 9 billion pounds of poultry for each year), and it is well equipped with its vast distribution infrastructure, which helps it to hold number one position.
It has mainly focused on the poultry industry so it applied quality management by conduction a close vision on different aspects of quality involving cost- benefit analysis of quality, understanding result of bad quality along with ethical aspects, which enhance the market. In the United States and in Mexico, It has more than 41,000 employees who involved in the entire production process and PPC has contracts with about 5,000 family farmers who supply the birds, feed, technological as well as veterinary services for the company.
The Annual report 2007 of PPC demonstrated that it was incorporated in Texas in 1968 and in the United States and in Mexico, it has more than thirty one chicken processing plants as well as eight prepared foods plants and twenty nine feed mills and 39 hatcheries to control the processing, preparation, packaging and sale of its product lines. This report also added that its aim to provide high quality foods in low price, so, it has constantly applied durable business strategies and to attract retailers and the foodservice industry, it has developed its research & development department.
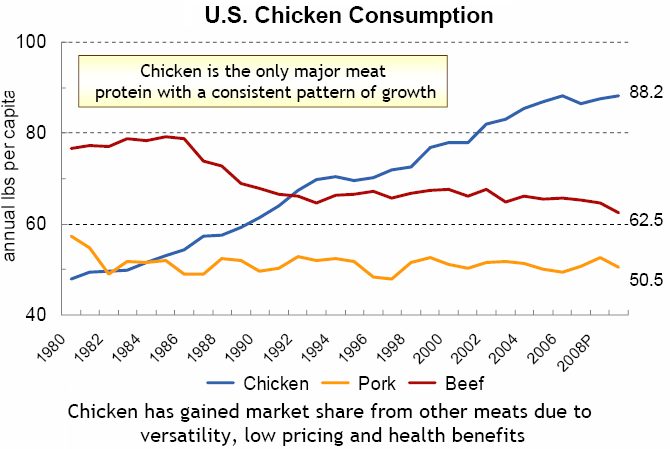
The following figure shows that from 1980 to 2008, the consumption of beef has decreased steadily where the chicken consumption has increased dramatically in US because of versatility, low pricing as well as health advantages. From this data, it can easily assume that PPC has large target customers to sale their products; in addition, it has designed its product line according to the customer choice, which enhanced its business.
The Annual Report of PPC (2007) argued that for the successful execution of acquisition with Gold Kist Inc and other largest distributor such as Puerto Rico, PPC has acquired a majority of the outstanding common stock by tender and this acquisition has positioned PPC as the world’s leading chicken producer. From the year 2003 to 2007, its sales of prepared chicken products has enlarged about $1571.3 million for these two successful acquisitions and it has reduced its feed ingredient costs up to 7% of total production costs due to acquisitions (Annual Report 2007 of PPC, 10)
However, corporate governance is the foundation of a disciplined corporation; therefore, Pilgrim’s Pride Corporation always follows corporate governance guidelines, code of conduct, recommendation of audit committee, the Company’s Proxy Statement and the Sarbanes-Oxley Act of 2002. The PPC also consider the sections 906, 302 of SOA 2002 for internal control of the company because in current recessionary period many large business corporation has collapsed for not to follow the sections of Sarbanes-Oxley Act.
Corporate social responsibility is the awareness of business organisation that their accomplishments have not at all kept any negative impact on the society; therefore, it has many social commitments, for example, PPC has strictly maintained the programme of animal welfare, which is organised to remove unnecessary damage and suffering for animals in the everyday operation of its production processes. For continues development of its product sales, it should provide more attention on training to develop its operating system considering the environment, animal welfare and health issues and it has already implemented the guidelines for animal welfare issued by the NCC (National Chicken Council) and NTF (National Turkey Federation).
Vision of Pilgrim’s Pride Corporation
PPC has presented its vision to be the world-class chicken company that would perform better than the best all over the global market as a distinguished numbered one company. The performance break down of the company has presented that in the US fresh chicken sector it has market share of 26 percent; for U.S. prepared foods PPC’s market share is 30 %. At the same time the US export data demonstrates that it perform 11 percent and US chicken export and 11% of US eggs export when the company has a market share of 22 percent in Mexican
Mission of Pilgrim’s Pride Corporation
Pilgrim’s Pride Corruption (2009) stated that its mission has been organised on the principle that their Job is exceptional Customer Satisfaction wit their performance. For about last sixty years, PPC has been dedicated its effort on healthy, first-rate food products for the global market. PPC has urbanised a number of those outstanding products that could benefit customers and stakeholders in US, Mexico, Europe, Asia, and rest of the worlds 31 countries.
Strategy of PPC
The objectives of the strategy of Pilgrim’s Pride are to amplify the sales of the organisation and maximising profit gaining outstanding growth and to become the leader of chicken industry. To move up the goals the company it has fixed up its mindset plan to prolong pursuing the follow grand strategies –
- Pilgrim’s Pride argues to capitalise on noteworthy scale along with leading chicken industry pose including its brand recognition. PPC believes that it has acquired the market and established the business relationships with a broader network of distributors and customers both in US local market and abroad. It is highly capable become the leader of chicken market overcoming all the challenges of the competitors.
- Pilgrim’s Pride has fully equipped to capitalise the eye-catching ready foods market of the United States. The Annual report of Pilgrim’s Pride Corporation (2008) pointed out that the fastest growing and most cost-effective and profitable segment in the poultry industry that it is a player of global market. The products sold by the company to market segment must necessitates further processing, which make it possible for PPC to incriminate a premium for PPC product by dipping the impact on other food feature costs. This would consequently the profitability does not keeping any impact on PPC. The humanizing and even out the profit margin of food element costs tropically diminish from a ranger of 33%- 49% of the total manufacturing when PPC chicken products product would show only 17% -24% reduction. This would provide a competitive advantage for PPC.
- PPC laid emphasis on customer-driven research and technology where the Information technology pays a revolutionary role for the sky scraping growth of PPC. Pilgrim’s Pride Corporation (2008) addressed that for increasing demand for PPC in fiscal 2004 to 2007 its sales for readymade chicken products has grew US$ 921.10 million to US$ 2,492.40 million in the financial 2007, which ahs accounted a 28.3% annual growth rate.
- PPC played a vital role improve the profitability of U.S. fresh chicken in the course of value-added and branded products. It capitalisation on export opportunities and ongoing strategic acquisitions lead the company to be the leader of the industry. Pilgrim’s Pride has been engaged it self to Improve operating efficiencies as well as boosted capabilities on cost-effectiveness.
Identifying External Opportunities and Threats
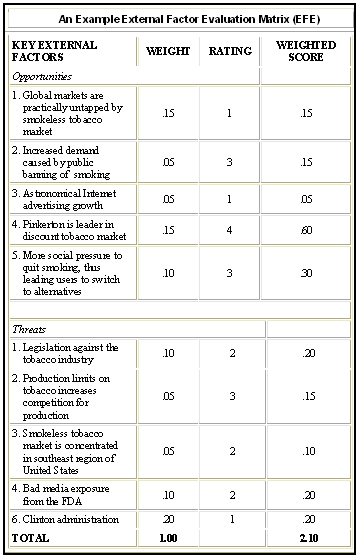
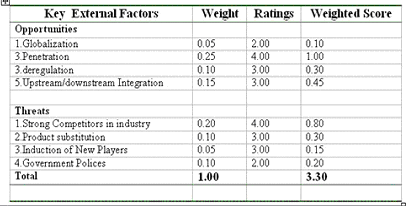
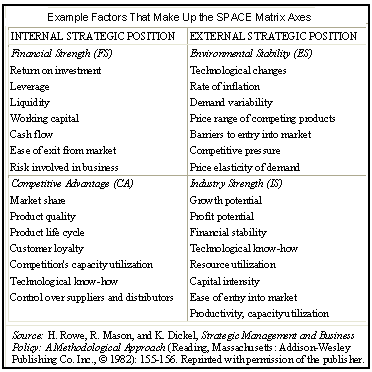
All of the mechanisms speckled around the external atmosphere of the company are the source to craft external opportunities and threats, for instance- demography, culture, economy, society, environment, political and legal, technology, and scope of enjoy competitive advantages. Identification of opportunities and threats are composed of five sequential steps are sequentially described in follow as well as modes of score for each component plotted in the table. This practice is also termed EFE matrix or the external factor evaluation matrix (marshall.edu, 16).
- Step-1: At first, list both of the external opportunities and threats as described in the external audit process along with weight, ratios, and percentage for each of the factors.
- Step-2: a significant force of an industry’s success is its weight. Ranges of the firm’s weight have to be 0.00 to 1.0 where 0.00 mull over not important and on the other hand, 1.0 is the most important. In addition, aggregate value of all forces should be 1.0.
- Step-3: evaluate the effectiveness of the current strategies while accommodate with the external factors. Considering factors are rating from 1 to 4. Remark of the each rating is as sequence- 1 carries poor, 2 is equivalent to bellow average, 3 follows average and 4 represents above average (Christensen, 35).
- Step-4: calculation of the weighted score has utilized the formula- “Weight, w X Rating, r = Weighted Score” for each factor.
- Step-5: finally, total weighted score is measured through the addition of all weighted scores calculated in the step 4.
Competitive Profile Matrix (CPM)
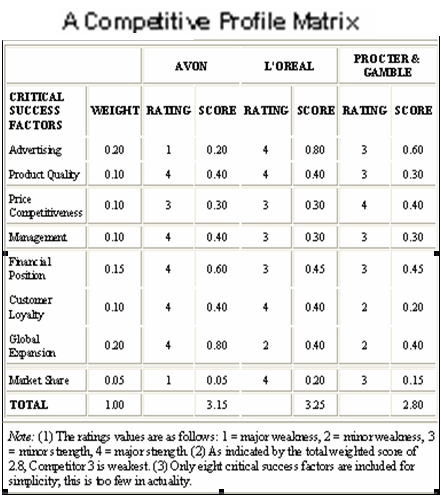
Critical success factors (CSFs) of the industry are entire into the strategic management process in which CPM matrix or the “Critical Profile Matrix” is an approach of this process regarding to critically evaluating its position compare to its rival. Methods of CPM are same for the different industries. In evaluation CPM, it dose not make bias to prior on either internal forces or the external factors. For example, EFE matrix is composed by the external environmental forces and on the other hand, IFE construct of internal strengths and weakness (Sooper Tutorials, 1).
Construction of CPM matrix: external environment is the source of collecting competitive intelligence information of the EFE and need not to concentrate on internal issues. However, CPM is different from EFE but its evaluation has to need concentrate on the CSFs along with the internal issues. Following are the steps of composing CPM matrix and subsequently a table of CPM matrix calculation (Sooper Tutorials, 1).
- First, available CFRs discover for the industry.
- Second, rely on the significance contribute to the organization’s success; each factor has to assign weight.
- Third, for the less important forces, weight range would be 0.0 and for the most significant forces, 1.0 would their weight.
- Forth, aforesaid three steps evaluated response of the factors towards organization’s success.
- Fifth, after the completion of weight, CSFs are required rating due to their effectiveness. Most effective feedbacks of recent strategies have plotted in ‘4’ and in case of poor effectiveness have placed in plot 1.
- Sixth, as regards to weight score, employed formula is- “Weight score = (Each factors’ weight, w X Each factors’ rating)”.
At last, art of acquiring average total weighted score is to sum all the weighted scores.
Constructing External Factor Evaluation (EFE) Matrix
As described in the external opportunities and threats of the organization, EFT matrix has also deals with a summarize form strategies which includes- economy, demography, culture, politics, legal affairs, technology, environment, society and the competitive information. Construction of EFE matrix has involved in following steps (Sooper Tutorials, 3).
- Critical success factors (CSFs) or the key external factors identification and listing.
- Considering less important and most important, range each factor’s weight 0 to 1. More specifically, 1 weight goes to the important forces and 0 weights for the inconsequential.
- Termination of the importance of the CSFs get starts to make a sequence of the efficiency of them from 1 to 4. Most efficient feedbacks would be carried out ‘4’ and for the inefficient rating would be placed ‘1’.
- This is the stage to estimate weighted score by-“Weight score = (Each factor’s weight, w X Each factor’ rating)”.
By addition of all the weighted scores average score will be evaluated.
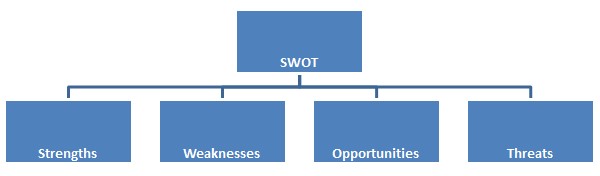
SWOT Analysis of Pilgrim’s Pride Corporation
In the case analysis of Pilgrim’s Pride, the strengths and weaknesses have considered internal key factors and the opportunities and threats have discussed the key external factors involving in the operation of the PPC (Kotler 33). The SWOT matrix of Pilgrim’s Pride Corporation has discussed in the following way –
Strengths
- According to annual report 2007 of Pilgrim’s Pride Corporation, it has excellent brand awareness and it added that it holds the highest position in the United States and its production is more than 20% higher than its nearest competitor is.
- In the poultry industry, it is the market leader for their processed chicken;
- It has strong financial condition to expand its business all over the world, for example, in Mexico, it is the second largest supplier of chicken;
- It has strong production capacity, for example, Annual report 2007 of Pilgrim’s Pride Corporation demonstrates that it has the capacity to process over 45 million birds for each week.
- It has control over the subsidiaries of the company as it always considers healthy products and provides safe and healthy foods to the customers.
- It has advanced technological support as well as administrative control to advance its product in market as its workers are efficient and they have experience & responsibility for internal controls within their side of accountability.
- It has effective audit procedure to identified internal risks, weakness as well as new business sector and to do this they take opinion of shareholders;
- Besides processed chicken, it has large product line; for example, it is popular fresh chicken business, pork, beef, eggs, Turkey products, and other food items.
Weakness
- Increase the rate of complain for personal damage or injury has increased the risk of the company;
- For global down turns, its position in New York Stock Exchange is decreasing; therefore, it lost more of its largest customers;
- Purchase power of the customers have reduced for continues job cuts by the employers;
- PPC has fear to lose its major customers because if it fail to hold them, It has to bear negative effect, for example, Wal-Mart Stores is the main retail customer as it accounted for 12% of PPC’s net sales and PPC always try to continue its business with Wal-Mart;
- Frequent change of exchange rates, interest rates, contamination of its products and for increase of product liability claim, it has to change its operation management.
Opportunities
- It has opportunity to provide high quality products and quick customer service with high satisfaction;
- Rivers (2008, p. 32) forecasted the last five year’s financial data of the company which showed that its market share has increased each year.
- PPC gained a new dimension by acquisition with Gold Kist;
- Many large companies have cut the job of employees but PPP has not cut the job of employees as it believes that it would be recovered their position by reducing the production costs;
- The Competitors of PPC have suffered financial crisis which brings large profits for the company as it reduce the competition in the chicken and turkey market
- According to annual report 2007 of PPC, it has financial capabilities to merge with other large companies to spread out its business worldwide.
Threats
- United nations has confirmed that H1N1 virus can be spread out by birds, as a result, Pilgrim’s has to face this new threat;
- From 2008, its sales and profits had decreased due to Global Financial Crisis and if it continue for a long time then it has to change its strategies;
- Besides swine flu, another disease like bird’s flu and further outbreaks of avian influenza or other bird’s diseases hammer its business because customer demand is changing, as they are health conscious.
- Risk factors like new immigration legislation imposed over burden on the company.
BCG Growth Share Matrix of Pilgrim’s Pride Corporation
By using the Boston- consulting group approach, the Pilgrim’s Pride Corporation can classify all its SBU’s as BCG Matrix is a strategic portfolio planning, where the business units of production is classified into four groups based on market growth, for example, (Cash usage by PPC) and market share (Cash generated by PPC) are comparing with competitors (David, 175). This is helpful to determine the business positions for determining profitability position of company. The following figure will show four specific groups of BCG Matrix.
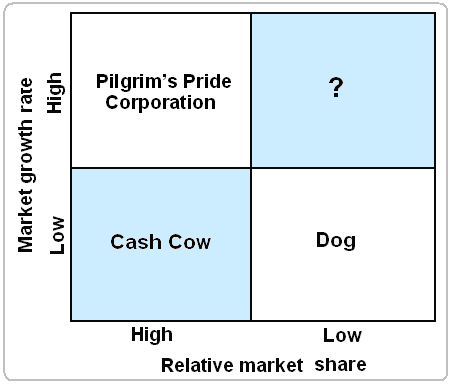
Consistent with BCG matrix, the market growth of Cash cow is small but relative market share is high, which indicates that for further expansion of its operations, it must need less investment than Dogs to sustain in market where Pilgrim’s Pride Corporation expresses opposite market growth from Cash Cow.
According to the situation of Dog, it can be assumed that both the market growth and relative market share are low, therefore, it requires large investment or loan facilities to expand or exist in markets. However, Dog’s production condition is differing from the financial condition of Pilgrim’s Pride Corporation as this company is not able to compete with other competitors.
In contrast, Question marks point out high growth and low-shared firms; as a result, they necessitate abundant resources of cash to carry on their share and move alone to increase them.
In this figure, the most important part is Pilgrim’s Pride Corporation, which located in the upper part of left hand side of the diagram. It represents that PPC is now in highest position in the matrix and it demonstrates that both the relative market share and market growth rate are in high position as PPC occupy the larger market share with a better growth rate than all of its competitors. As a result, it should require low investment than others and by following its strategic decisions, it can hold perfect market share for a long time.
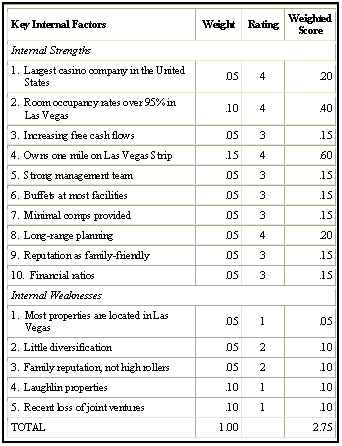
Constructing Internal Factor Evaluation (IFE)
Concept of the IFE matrix is appraised by the internal audit of the organization. More specifically, internal strategic management is the resource of IFE. Trade-off between major strengths and weaknesses execution of the internal audit is terminated. IFE matrix makes aid during decision-making and necessary transformation adoption. Moreover, IFE is an art rather than science. Almost equivalent to the EFE matrix and the CPM matrix, construction has to pass through five sequential steps described in below and following this, an IFE matrix is also plotted (Sooper Tutorials, 3).
According to internal audit process, first list all of the key internal forces or the strengths and weaknesses of the organization and also specify them by ratios, percentages or comparative numbers.
Considering sincerely aggregate weight of all the key forces 1 make a weight range from 0 to 1. Same as above discussion, 0 goes to the not important where as 1 is for the most important.
Another repetition will accomplish in rating stage ranging from 1 to 4. Remarks caring each rating are in sequence- 1 represents major weaknesses, 2 for the minor weaknesses, 3 goes to minor strength and finally 4 carries major strengths.
Each variable’s weighted is determined by– “Weight score = (Each factor’s weight, w X Each factor’ rating)”.
At last, average weighted score of the organization is expertise by the addition of all weighted scores.
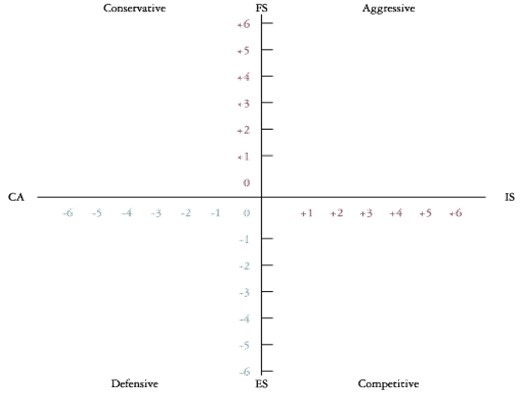
Strategic Position and Action Evaluation (SPACE) Matrix
In an organization, framework of the SPACE matrix is composed of four quadrants or by the phases named- aggressive, conservative, defensive, and competitive respectively. Based on the strategic position most efficient strategies are prescribed for the target organization. During sketch of the overall strategic position, SPACE matrix has divided by two internal and tow external axes and both of those contain two dimensions. Internal dimensions composed of financial strengths and competitive advantages where as environmental stability and industry strength construct the external dimensions. Probable steps of arrange SPACE matrix is described in bellow (marshall.edu, 27 – 31)
- Stage 1: define all possible variables stayed under the both of dimensions.
- Stage 2: both positive and negative numerical value ranging from 1 to 6 define best and worst variables. For best, plot +1 to +6 sequentially and for the worst plot – 1 to – 6 in accordance.
- Stage 3: “Average score = (Variables of the dimensions / Number of variables)”, employed of this formula calculate the average score for each dimension.
- Stage 4: according to the calculation, plot them in the appropriate axis.
- Stage 5: primary task of the SPACE matrix is addition of two scores both in X and Y-axis and draw intersect of the xy point.
- Stage 6: considering the average value and intersect line organization’s strategies as well as its type will be determined among the four dimensions.
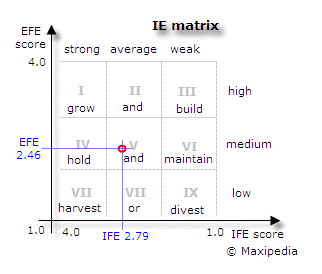
Internal External (IE) Matrix
Both working atmosphere and the business’s strategic position are evaluated through this approach. In short, a combination of two famous strategic models the EFE matrix and the IFE matrix is the outcome of IE matrix. Vital feature of the matrix is graphically, scores of the IFE matrix is plotted in the X-axis and in the Y-axis, scores of EFE matrix is stayed. In following figure IE matrix is briefly explained along with its three major regions and early of this graph there have short description of these (Maxi-Pedia, 3).
- First, grow and build strategy is appropriate for the cells I, II and III.
- Second, hold and maintain strategy is most applicable for the cells IV, V, and VI.
- Third, harvest or exist strategy is the feature of the cells VII, VIII and IX.
Grand Strategy Matrix and Quantitative Strategic Planning Matrix (QSPM)
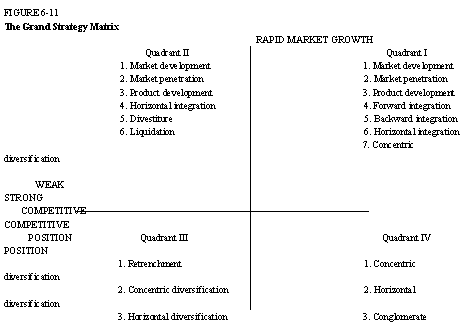
Grand Strategy Matrix
Constructing alternative strategy an efficient and most popular matrix is the Grand strategy matrix, which is composed of fur quadrants. Firm’s position and strategy alteration are decided based on the poison of the company in the Grand matrix. According to the following figure, quadrant 1 represents rapid market growth, quadrant 2 is for diversification, and quadrant 3 goes to slow growth and weak position in the industry and finally, the quadrant 4 showed the strong business position of the business firm (iun.edu, 1-2).
Quantitative Strategic Planning Matrix (QSPM)
Fugitive from the SWOT (Strength Weakness Opportunity and Threat) QSPM matrix plotted all of the strategies of a firm in a sequence and has developed through six sequential stages as described in below (marshall.edu, 38 – 41)
- Stage 1: prepare the inputs from the QSPM for analyse and matches results with the stage 2. In other words, EFE Matrix, IFE Matrix, and the CPM had developed the first stage.
- Stage 2: construction of this stage is held by TOWS Matrix, SPACE Analysis, and BCG Matrix,
- Stage 3: analysis of stage 2 QSPM is the souse of constructing stage 3.
- Stage 4: evaluate more and less attractive scores for each strategy and categorized them in sequence as showed in the following table. Score ranges have to be 0 to 4. Most attractive will get the 4 and not acceptable get the 0.
- Stage 5: calculation of total attractive score is measured here by multiplying stage 2 and the stage 4.
- Stage 6: in the last stage, sum of total attractive scores of the QSPM approach is calculated for each column and based on scores each column is remarked as attractive, not attractive, most acceptable, probably acceptable etc.
Table V: QSPM matrix for the Pilgrim’s Pride Corporation.
In this case the QSPM is being shown for PPC bellow. There are two alternative strategies where Alternative 1 says that PPC should expand the international markets and Alternative 2 indicates its national position.
Here, Attractiveness Score: 1 = not acceptable;
Attractiveness Score 2 = possibly acceptable;
Attractiveness Score 3 = probably acceptable;
Attractiveness Score 4 = most acceptable;
Attractiveness Score 0 = not relevant
According to the matrix, Pilgrim’s Pride Corporation has enough capability to expand its business in international market as well as it can continue its business in national market.
Implementation of Specific Strategies
For implementing the proper strategies, PPC has to take some actions. These can be:
It can take business extension strategy. For extension, it could take dairy and fish related food products. As the customers of the company are potential customers of these food products also, the company is expected to earn a good response from the customers. Besides, as the market of dairy and fish is one of the most important one, which has high profit margin, the company is expected to earn high profit margin. This will help to implement the addition of the new customers.
It can also take the market penetration strategy by introducing new dimensions of its existing products and to offering the present customers. This can be introducing different ready-made chicken foods, which were not in the production list of the company before. Again, it can add new flavour in the present foods. Different chicken related food products of different cultures can also be introduced under this strategy.
Another important step is to heavy investment to maintain the leading market position and to make steady the brand recognition. The present market share of 25% should be increased. (Annual Report 2007 of PPC, 77)
The market of prepared food is lightened in the United States through various prepared food companies. The implementations of different specific strategies are depended on capitalization of making the market more attractive.
Before implementing, the strategies there must be some research activities done by the company. The main objective of these researches will be to identify the acceptance within the customers.
Preparing Forecasted Ratios
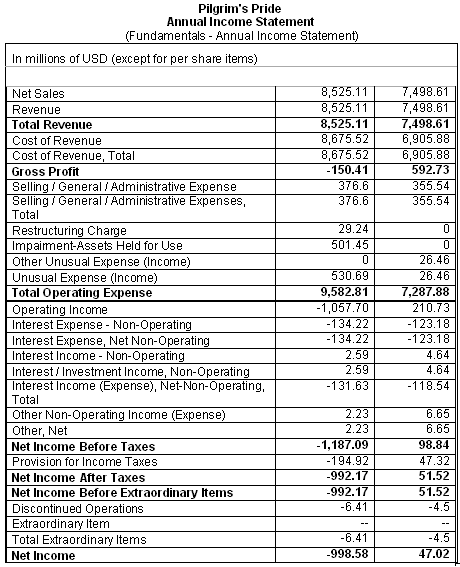
Forecasted ratios are helpful for the corporation and other stakeholders to know about the true and fair view of the company. These ratios are prepared for the performance measurement of the following years of the business (Besley, 265). The Net Income and Balance Sheet of recent two periods are given below for further forecasting ratios: (Fundamentals – Annual Balance Sheet)
Pilgrim’s Pride
Annual Balance Sheet
Source: Fundamentals – Annual Balance Sheet.
Liquidity Analysis Ratio
Liquidity ratio shows the relationship of Pilgrim’s Pride Corporation’s cash and other current assets to its current liabilities.
Current Ratio
By this, the portion of current liabilities are covered by current assets are considered.
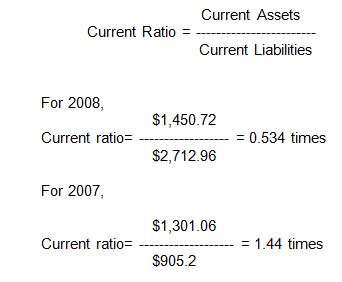
Assumption: By these ratios, it is seen that, in 2008, the ratio is stand in 0.53 times and in 2007, it is 1.44 times. But with the standard of current ration, it would be at least 2 times. So, in current period, the current ratio is not in good position, which means, the portion of liquid assets are not enough to meet the liabilities of the company.
Quick Ratio
This ratio is indicating the variation of current ratio, which is, how quick assets are covered current liabilities.
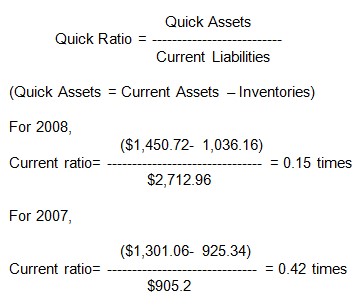
Assumption: The standard of quick ratio is 1 time. But in these two years’ quick ratio, no one is stand 1. So, the quick ratio is not appropriate for both years. The corporation has less ability to meet up its quick assets according to current liabilities.
Net Working Capital Ratio
The working capital or assets in hand of Pilgrim’s Pride Corporation is measured comparing with total assets.
Net Working Capital = Current Assets – Current Liabilities
For 2008,
Net Working Capital = $1,450.72 – $2,712.96 = $ -1262.24
For 2007,
Net Working Capital = $1,301.06 – $905.2 = $395.86
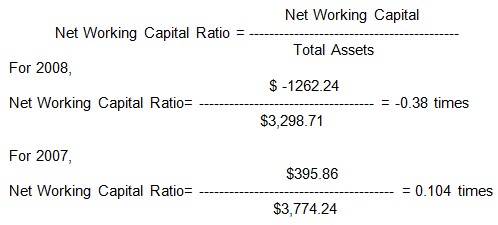
Assumption: Here, Net working capital ratios of both years are under 0.50, but the standard is it. So, Pilgrim’s Pride Corporation has to improve Net Working Capital Ratio to improve the working capital for the company in more effective way.
Profitability Analysis Ratios
These ratios are showing the effect of liquidity, asset management, and debt management on operating results of Pilgrim’s Pride Corporation.
Return on Assets (ROA)
Return on Assets provides an idea of overall return on investment earned by the company. The ratio is multiplied by 100 to measure the percentages of the ROA.
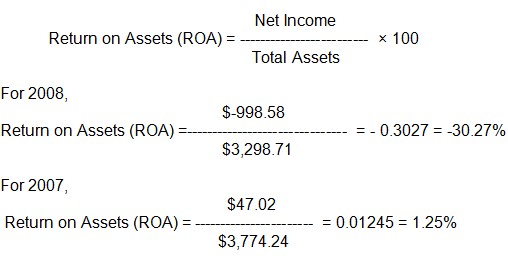
Assumption: As in these two years, ROA is lower, which indicates that, Pilgrim’s Pride Corporation is using fewer assets according to its income of the annual year.
Return on Equity (ROE)
ROE is measured the rate of return on common shareholders’ investments to Pilgrim’s Pride Corporation.
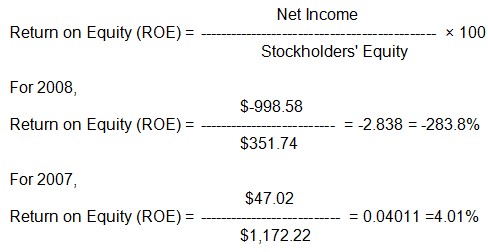
Assumption: The Company is using less debt in these two years, but using net income to the common shareholders’ equity in these high ROE is not good for company.
Profit Margin
This ratio is indicated the net income per dollar of sales of Pilgrim’s Pride Corporation.
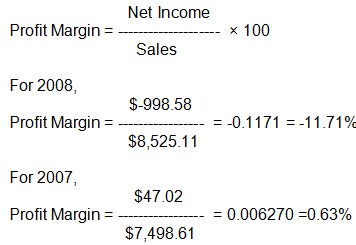
Assumption: The ratios of Profit Margin in these two years are totally different, which indicates the sales in recent period is occurring loss and in 2007, profit margin was not in good position.
Activity Analysis Ratios
These ratios are measuring the effectiveness of managing assets of the Company.
Assets Turnover Ratio
This ratio is measured the effectiveness of using assets to help generate sales of Company.
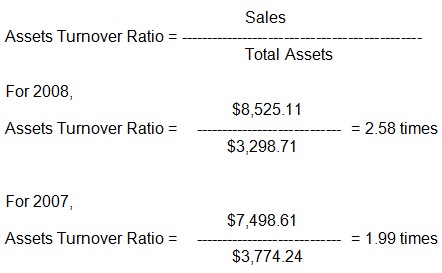
Assumption: The effectiveness of asset turnover is increased in every period, shown by measuring the ratios of 2008 and 2007.
Accounts Receivable Turnover Ratio
This ratio helps to measure the effectiveness of account receivables in terms of sales.
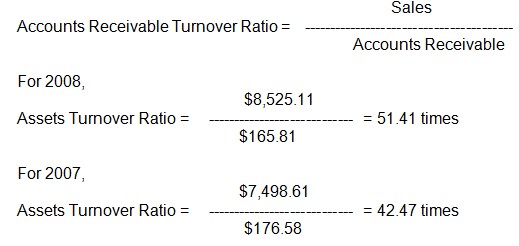
Assumption: In 2008 and 2007, accounts receivables are helped generating sales in effective times, more effective in recent period.
Inventory Turnover Ratio
By this ratio, the inventory is measured in terms of stocked or sold out, considering the times of the ratio.
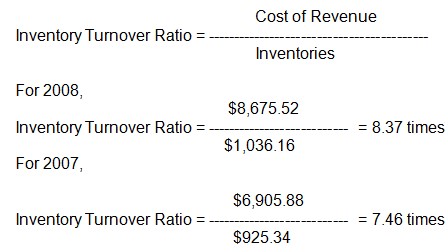
Assumption: By these ratios, it is estimated that, the goods are sold out or used over 7 and 8 times in these recent two years in terms of inventories in hand by Pilgrim’s Pride Corporation.
Capital Structure Analysis Ratios
These ratios are indicating the capital management of shareholders in terms of liabilities and interests of the Company.
Debt to Equity Ratio
This ratio is indicating the portion of debt can be met up with the help of Shareholders’ equity of the Company.
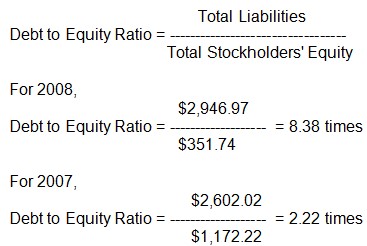
Assumption: To cover the liabilities with shareholders’ equity can be done easily by Pilgrim’s Pride Corporation in recent period.
Interest Coverage Ratio
This ratio is helpful to measure the ability of Income to cover the interest expenses properly.
Income before Interest and Income Tax Expenses = Income before Income Taxes + Interest Expense
For 2008,
Income before Interest and Income Tax Expenses = $-1,187.09 + $(-194.92) = $- 1382.01
For 2007,
Income before Interest and Income Tax Expenses = $98.84 + $47.32 = $146.16
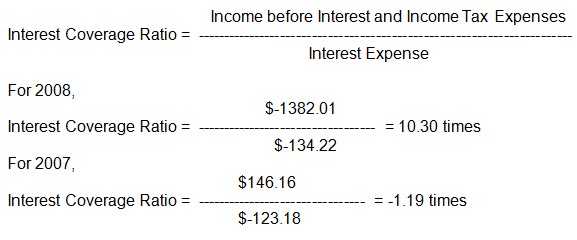
Assumption: Pilgrim’s Pride Corporation has the efficient ability to maintain and cover the interest expenses according to Income of it in recent period, not enough position in 2007.
Capital Market Analysis Ratios
These ratios are helping to analysis the market conditions of capital according to price of stock, book value of stock, dividend, and dividend payout by the Company.
Price Earnings (PE) Ratio
This ratio is helping to analyze the market price of shares considering with the earning per share of the Company.
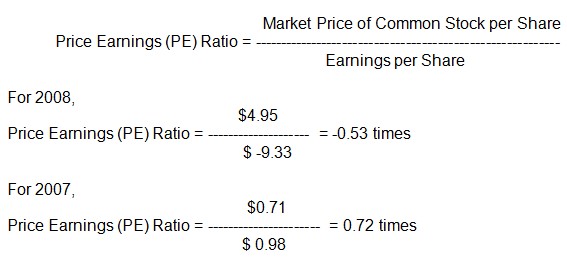
Assumption: Price earning ratio is more in recent year, which indicates that, Pilgrim’s Pride Corporation has not had the effective market price of stocks to cover the earning per share.
Market to Book Ratio
This ratio is measured the book value of stock price considering the market price of stocks of the Company.
Book Value of Equity per Common Share = Book Value of Equity for Common Stock / Number of Common Shares
For 2008,
Book Value of Equity per Common Share = $351.74 / 74.06 = $4.75
For 2007,
Book Value of Equity per Common Share = $1,172.22 / 66.56 = $17.61
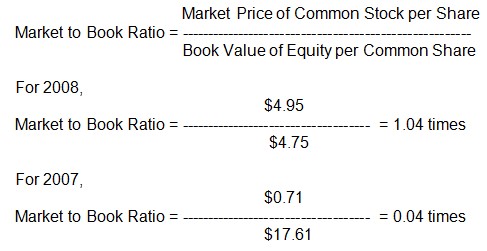
Assumption: The Company has the ability to cover the book value of stocks according to market price in the market in recent period.
Preparing Projected Financial Statements
To prepare Projected Financial Statements of Pilgrim’s Pride Corporation, first it is important to know the financial statements of the Company, which is shown in the part before forecasting ratio analysis of the company.
For preparing projected financial statements, first Pilgrim’s Pride Corporation has to develop a growth rate, which indicates times to increase proportionately with factors. [Growth rate= (1+g)n ]. Here, the growth rate is assumed as 10% increased in every year, which is shown in the effect of next year.
Assumption of Projected Financial Statements
From the projected financial statement, it has demonstrated that, Pilgrim’s Pride Corporation is not in good position in current period. It would be in better position in the forecasted future annual year, if the position of the company would be, remain same. As it is seen that, the company has in condition of loss in the income year of year 2008, and would face more loss in the upcoming income year. Thus the assets portion are satisfactory, the shareholders’ equity is as dissatisfied.
Presenting Agenda for Actions
The Pilgrim’s pride Corporation has to select some strategies to increase its brand recognition, strategic superiority, and market share. To select and implement these strategies PPC has to take some actions. First PPC has to prepare an agenda, which will give idea about the appropriate paths to achieve the objectives. The agenda is consisted parts as follows:
- Structuring appropriate goals and objectives: To select and implement the strategies, PPC has to set some goals and objectives. These goals and objectives must be in accordance with the resulting outcomes of the strategies. Every strategy has to follow some procedures and the goals and objectives have the target to maintain the procedures.
- Results of the strategies: In this part, the outcome of the strategies will have to be designed. This part will be helpful to implement the strategies in a sense that it will clarify the meaning of taking the strategies. The reason behind the choosing of a strategy can easily be identified by the outcome or result of that strategy.
- Cost-benefit analysis: The neat part is to do cost-benefit analysis for each strategy. To implement a strategy, the company has to incur some cost. This cost must be less than the benefit or outcome it earns. If the cost of implementing the strategy is higher than its resulting benefit, it will not feasible for the company to implement the strategy.
- Design plans to achieve the objectives: In this part the massive assessment of the objectives, techniques to achieve those objectives and other relevant matters are discussed which will help to simplify the achievement of the objectives. This will introduce a large scale planning including the management, human resource, costing and technological ingredients.
- Comprehensive explanation of the plan: This part gives the full picture of the strategic plan. Here all the relevant information will included along with the proper identification of the way of implementation. In this part, the nature of the strategy gives the full meaning.
- Implementation of the strategic plan: This is the last part, where the all previous activities have tied together and finally implement the strategy.
Recommendations for Specific Annual Objectives
PPC has to ensure the right choice of objectives. It should target those goals, which are feasible to attain. It has limitations in resources and annual expenditures. The specific annual objectives are depended on the resources so it must pay its highest concern for attaining the highest possible outcome by using lowest resources.
It must become customer oriented. The downturn conditions of the previous year primarily show the consequences of ignoring the customer expectation. Now customers need more than the chicken only. PPC must know what its customers are demanding and must design its product offering according to the demand.
Annual projection of the financial data can be a basis for the outcome. Base on the projection for 2009, PPC should establish a target for the year. To get the target, the company should concern on the quality of their products. Its present loosing condition can be overcome by this way.
The introduction of technology for the present year can be act as an important factor to overcome the present downturn. Technology in production and other means of operation can give the company the possibility to produce and serve more in a short time.
Recommendation for Procedure Strategic Review and Evaluation
PPC will have to concentrate on to expand its business outside the North America. There are many countries where the idea of readymade food is not been introduced yet. In those countries PPC will get the opportunity to become the pioneer and to achieve the first mover advantage. This will give the company to become an international company and to get good profit margin.
Recently it has done an acquisition. The tendency of acquisition requires some capital. This tendency can be harmful for the company as it has now becoming a losing concern. After the overcoming of this condition it can do acquisition in later.
In every case of the operation it must do a cost-benefit analysis. In many cases, it was seen that the strategy or action taken by the company was not cost effective which lead the company to loss. To avoid these types of situation, the company must choose the cost benefit strategies and actions.
The company must give its highest effort to enhance its brand recognition. It should take the help of different Medias like TV, radio, News paper and other traditional ways to take massive promotional activities.
Conclusion
The whole report has addressed the critical troubles and drawn attention on the Pilgrim’s Pride Corporation’s current position in the national and international market, its major competitors, along with external opportunities and threats and internal strengths and weaknesses. The strategic analysis of this report has also recognised that the PPC’s major missions and visions to maximise profit by developing new growth strategies. The PPC has to select some strategies to increase its brand recognition, strategic superiority and market share, in addition, it capitalise on attractive US prepared foods market and improve fresh chicken productivity through value-added, branded products, and highlights customer-driven research and technology.
From the financial ratio analysis, it can assume that it is not in good position in present time and it should take time to recover its situation. Moreover, Swine flu (H1N1 Virus), birds diseases, like bird’s flu, further outbreaks of avian influenza, new rules and regulation, global financial crisis and the claim of personal injury have reduced its net income and net sales. The ratio analysis also shows same kind of result, there is a high deviation between the strategy-implemented period and before the implementation of the strategy and the report suggests the way to overcome, evaluate, and control the strategic implementation for the long run superiority.
However, the executives of PPC are optimistic to solve the economic crisis within 2010 as the macroeconomic situation of US has lingered within a controllable position to over come the budget deficit by way of the tools of fiscal and external accounts measures intended for medium term. In order to implement or change the strategy, PPP should require to analysis its income statement, balance sheet, competitor’s strategic management, alternative strategies for the firm and financial ratios of the company.
Works Cited
Besley, Scott & Eugene Brigham. Essentials of Managerial Finance. Thomson South Western, 2006-2007.
Christensen Roland, Norman Berg and Malcolm Salter, Policy Formulation and Administration, Homewood, Ill: Richard D. Irwin, 1976, p. 16-18.
David Fred, Strategic Management concepts, 12th edition, Prentice Hall. 2008. Web.
inu.edu, Internal External (IE) Matrix. Web.
inu.edu, The Quantitative Strategic Planning Matrix (QSPM). Web.
inu.edu, Grand Strategy Matrix: 2009. Web.
Kotler, Philip, & Kevin Lane Keller, Marketing Management, New Jersey: Pearson Prentice Hall, 2006.
Maxi-Pedia, Internal-External (IE) Matrix. Web.
Muuka Gerry Nkombo, How to Analyze a Business Policy Case, p. 1-3, 2008, Murray State University. Web.
marshall.edu, Steps in Preparing a Comprehensive Written Analysis. Web.
Pilgrim’s Pride Corporation, Building a world-class food company: Pilgrim’s Pride Corporation 2007 Annual Report. Web.
Pilgrim’s Price, The Pilgrim’s Story. Web.
Pilgrim’s Pride Corporation Fundamentals – Annual Balance Sheet. Web.
Pilgrim’s Pride Corporation Fundamentals – Annual Income Statement. Web.
QSPM Quantitative Strategic Planning Matrix. 2009. Web.
Rivers Clint, Company Overview of Pilgrim’s Pride Corporation. Web.
Sooper Tutorials. What is Competitive profile Matrix – CPM. Web.
Sooper Tutorials. How to Develop External Factor Evaluation (EFE) Matrix.
Sooper Tutorials. How To Develop Internal Factor Evaluation Matrix- IFE Matrix. Web.
Sooper Tutorials. The Quantitative Strategic Planning Matrix (QSPM). Web.