Introduction
This paper intends to prepare trend analysis and financial ratios from a minimum of four years for the Woolworths Limited (or “Woolworths”) under the food distribution and convenience stores industry (Reuter.com, 2009). This will therefore assess the company’s profitability, assets efficiency, liquidity, and capital structure and market performance for the four or five years. In addition, the company’s financial ratios will be compared to that of Coles Supermarkets of the same industry as well with available data from industry averages which could represent the financial ratios of it average competitors.
Analysis and Discussion
Profitability and Asset Efficiency
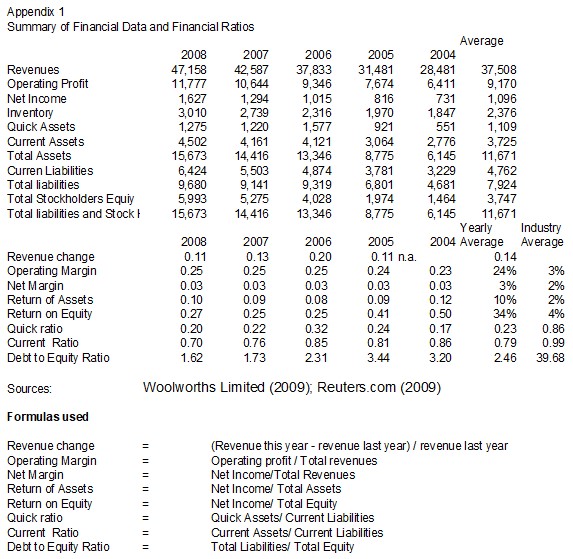
To analyze the company’s profitability and asset efficiency, a summary of the financial ratios is found in Appendix I. The financial ratios are computed using the accounts one account from the financial statements in relation to the others. Financial statements which include the balance sheet, the income statement and cash flow statement are taken from the annual reports of the company (Woolworths Limited, 2009).
Balance sheet presents the financial condition of the company and can be expressed in terms of assets, liabilities and stockholder’s equity. The income statement includes the elements of revenues and expenses whereby the financial performance of the company is measured annually. The cash flow statement provides details on how the company has souced and used its cash in either operating, financing or investing activities (Meigs, Meigs, and Meigs, 1995). As to how the accounts from each elements from related or compared with one another required the used of formula as may be seen in Appendix 1.From the said summary it can be observed that Woolworths’ revenues consistently increased for the past four years averaging about 14% years and in no year has the growth been lower than 10%. Such revenue growth may indeed explain the company’s profitable and efficiency position.
Its average return on equity (ROE) for 34.0% for the past five years shows superiority about its past performance in relation to the industry average of 4% as benchmarks (Birt, et al, 2008). An average of 34% return on equity definitely attracts investors, as it would mean that for every 100 Australian dollars the investors expect returns of about twenty more than one-third or 34. Said rate could be viewed as something extraordinary for a company like Woolworths given the economic slowdown or recession or near not only in the Australia but also in many parts of the world.
It may be noted that return on equity uses the formula where net profit is divided by the total stockholders’ equity (Meigs and Meigs, 1995). When compared to an average rate of 3% if money was invested in a bank, its present ROE of 34% makes it to more than eighty times and the rate is something very remarkable to find for investors. The 3% is the Australian base rate that could represent the risk free rate investment in the Australia (Housepricecrash.co.uk, 2009) and could be used as the minimum bank rate for a risk free investment.
Aside from profitability, it is also appealing to know whether the company’s asset management is efficient. To measure the latter, this paper uses return on assets (ROA). The company’s average ROA for the last five years of 10% or its ROA of 10.36% for the latest twelve months is still higher than industry average of 2. While ROA may indicate profitability measure, the same may also tell how efficient management the company had in terms of profits in relation assets employed in business. ROE alternatively measures how much management compensates resources invested by stockholders (Meigs and Meigs, 1995).
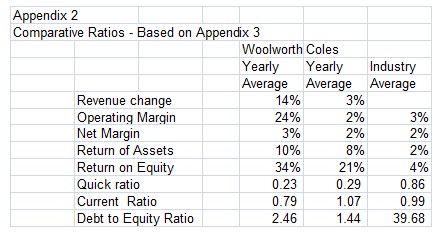
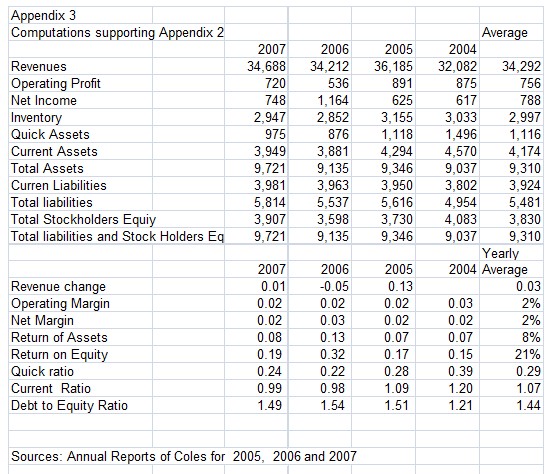
By comparing the two ratios, it appears that Woolworths is both profitable and efficient than Coles and event as against industry averages. See Appendices 2 and 3. This means that the company is really very profitable. It should be noted that the financial ratios for Coles Supermarkets were extracted from the annual reports for 2007, 2006 and 2005. Since 2004 figures are part of the annual report for 2005, the same was included and therefore for purposes of comparison, average financial ratios were extracted for the last four years by adding the each ratios and dividing the total to 4 years. See Appendices 2 and 3.
The understandable profitability and efficiency of the company is further proved by the company’s net operating margin and net profit margin. The resulting operating profit margins for the last five years averaged at 24% as against the industry average of 3%. Operating margin results after deducting cost of sales or services and operating expenses from total revenues. The ratios mean that the management of the company was is doing well in management of its business assets with the participation of its motivated employees in delivering value to customers.
In deriving net profit margin, the operating margin needs some values to be added or deducted still such as interest income, interest expense and other non-operating items. The ensuing net profit margin could either increase or decrease the net operating margin. An increase would connote that the company is having additional income from non-operating activities but a decrease would mean that it is spending some costs like interest expenses in having to finance some borrowing for the company.
Woolworths’ average net margin for the last five years was posted at 3% as against industry average of 2%. If the rate is compared the operating profit margin, it could be found that net profit margin is lower. This means that the company needed to spend other expenses to finance some of its borrowing. If further means that Woolworths is using other people’s money while improving profitability for stockholders. No wonder the company had very high return on equity as earlier analyzed.
The company’s profitability ratios such as return to equity, operating profit margin and net profit margin show the capacity of the company from a historical perspective. Between believing whether past profitability and liquidity would continue, it is more logical to believe that the company could repeat what happened in the past and that is a plus factor in influencing the company’s stronger financial condition and higher prices of its stock as a final barometer on how the company is expected to benefits its stockholders.
Liquidity
A liquid company’s must be able to pay its currently maturing obligations as they fall due (Birt, et al, 2008). The said liquidity is measured using the current ratio and the quick asset ratio. To get current ratio, one uses current assets to be divided to current liabilities. Quick assets ratio is almost similarly computed as the current ratio except that the inventory and prepaid expenses are being removed from the current assets to have a new numerator but the denominator is the same (Meigs and Meigs, 1995). Quick assets therefore normally include cash, marketable securities, and accounts receivable and the use of quick asset ratio is very much relevant for one intending to have higher form of measuring liquidity. In such case, one would prefer quick asset ratio to that of the current ratio (Meigs, Meigs & Meigs, 1995).
When applied now to Woolworth, its computed average current ratio is 0.79 as against that of Coles’ at 1.07 and industry average of 0.99. Quick ratio of the company on the other was reflected at 0.23 as against that of Coles’ at 0.29 and industry average of 0.86. Both ratios of the company are below 1.0 and lower than competitor Coles and the industry average indicating a less superior liquid position. How, its current ratio of 0.79 may still be considered as not too low because the company is in the food distribution and convenience stores industry and it can easily generate funds to increase its liquidity. A declining trend however was noted for the past five years. See Appendices 1, 2 and 3.
Capital Structure
Capital structure may be describe in terms of solvency which means long-term capacity of a company to keep up it stability over the long term (Meigs, Meigs & Meigs, 1995). Normally measured by the debt to equity ratio, with the formula of having the total debt of the company divided by its total equity, solvency should comfort investors that the company will not just survive the short term but it must also have a long life to recover long term investments which takes years to produce the needed returns. The average debt to equity ratio for five years of Woolworths is 2.46 as against 39.68. See Appendix I. The solvency ratio of the company is almost sixteen (16) times better than the industry average and this means the value the company investments from stockholder is much stronger for the company as against its average industry competitors. However compared with Coles, the latter is slightly more solvent with debt to equity ratio of 1.44. See Appendices 1, 2 and 3.
Despite having high debt to equity ratio, the ratio can be considered as an evidence of good capital structure for Woolworths as against competitors that could justify further expansions in the future without falling to be as riskier than present competitors. It means, in simple terms, that the company is able to manage its long terms risk that its profitability was enough to provide funds not only to pay currently maturing obligations but even to provide good amount of dividends annually to investors if the company want to do so and even to make future expansion.
The company manifested improving capital structure for the past five years and this should explain a priority of improving the same as compared to its liquidity which continued declined over the last five years in comparison.
Market Performance
Its market ratios will tell how well the stocks Woolworths are valued by the stockholders. When management tries to maximize the wealth of stockholders (Brigham and Houston, 2002), there must be a way to measure the same. Some measures of attaining the objective is determining how valuable are the stocks of the company in relation to its earnings and its book values of the company. The information from Reuter.com (2009) includes the summarized the market ratios for the company as against its competitors in the industry.
Using P/E ratio as basis, the company is definitely better at 19.33 for the latest twelve month as against industry average of 0.43. For lack for price per share of Coles, no comparison on price-earnings ratio could be made. Its higher valuation ratio ratios signify that investors would risk more in buying the company’s stocks than competitors, yet industry competitors are riskier in terms of higher beta of 0.65 as compared with that of the company at 0.52. Reuters.com (2009). This finds support from the fact that the company is more solvent, profitable and efficient than its average competitors in the industry.
Conclusion
Given the company’s still high profitability, asset efficiency ratio and better solvency but lower liquidity compared to competitors in the industry including Coles, there is basis to make investments with the company’s stock. The company may be more risky than Coles but it is less risky than the industry but it is more profitable but short term liquidity could be a problem since it may cause non-payment of currently maturing obligations. Since profitability is evident, liquidity could still be improved to match that of the industry or to bring it up to at least 1.0 level. What actually happened was that management caused management to keep better solvency as a result of higher profitability but it could still its profitability to improve liquidity while the company is still being less generally less risky in terms of solvency on the average.
That fact that it is performing above average despite the slowdown in economic condition proved that it would be able to take advantage its industry opportunities when the economy will eventually recover and the incomes of its customer will be increased eventually as a result. This and other reasons discussed should be good reasons to justify investments with the company.
References
Annual Reports of Coles for 2005, 2006 and 2007.
Brigham and Houston (2002). Fundamentals of Financial Management. London: Thomson South-Western.
Housepricecrash. (2009). US Base rate. Web.
Meigs, Meigs and Meigs (1995). Financial Accounting. London: McGraw-Hill
Reuters. (2009). Industry ratios. Web.
Woolworths Limited (2009). Financial Statements 2004 to 2008. Web.
Birt, J., Chalmers, K., Beal, D., Brooks, A., Bryne S. & Oliver, J. (2008) Accounting: Business Reporting and Decision Making. Second Edition Melbourne: John Wiley & Sons.