Introduction
Quantitative analysis is an important field of management as it is used to interpret, investigate, analyze and forecast the real world situations using scientific methods. Pictorial representations are the primary step for the analyses. Pie chart and histogram are the graphical tools here. Here we analyze the given data using descriptive statistics, correlation and regression analysis. The final step is to forecast the future turnover.
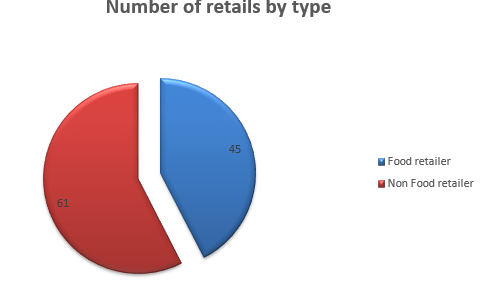
The frequency table of number of retails by type is as follows:
Table 1.
The pie chart of the above frequency table is
The frequency and percentage frequency table of number of employees of all retail shop is given as follows:
Table 2.
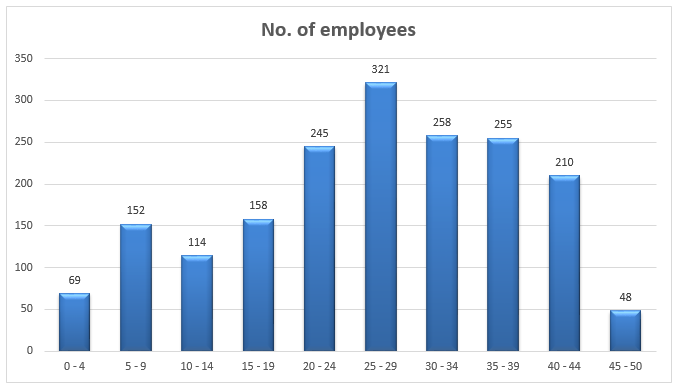
The histogram representing the frequency of number of employees of all retails is as follows:
The following table gives the descriptive statistics for the turnover data for all retailers, for food retailer and non-food retailer.
Table 3.
Number of Employees
The total number of employees in all retails is 1830 and we can determine the distribution of the number of employees in the percentage frequency table, as well as the histogram. 25 – 29 is the class interval of employees which has the highest frequency, with highest percentage of 17.54%. From the histogram also we can determine this. The lowest frequency class is 45 – 50 having 2.62% of total frequency. From the histogram we can determine that the distribution of the number of employees is approximately of normal distribution but is skewed positive. A further analysis on the normality and skewness of the data, we can find it exactly.
Average Turnover
From the descriptive statistics table, we can find that the average turnover for all the retailers is £2.28m. The average turnover for food retailers is £3.17m and the average turnover for non food retailer is £1.66m. Hence the average turnover of the food retailers nearly doubles that of the average turnover of non food retailers. The food retailers produce higher turnover than the non food retailers. Even though average is a good measure of central tendency, it is not robust against the extreme values (Freund, 1999). So taking the measure of median will overcome this problem as median is robust of extreme values.
Looking at the median turnover of the retailers, the food retailer has the highest median of £3.18m whereas the non food retailer has only £1.3m. Here the average and median are nearby which agrees the distribution is approximately symmetrical. The mean, median and mode are nearby for the food retailers indicating a symmetrical distribution. Whereas for overall, and non food retailers, they are different indicating an asymmetrical distribution.
Turnover Spread
The measures of central tendency lack the detail of individual data. The measures of spread give the detail of individual data. Standard deviation is the important measure of spread which states the average deviation of each data from the average value. Higher the spread, the stability is less (Weisstein). Looking over the sample standard deviation for the retailer’s data, the food retailers have £1.53m and the non food retailers have £1.41m as standard deviation. The overall standard deviation for all the retailer is £1.64m. The standard deviation for both retailers is nearby and hence the variability of turnover of retailers is almost equal.
Another important measure of spread is quartiles. They divide the ordered data into four equal parts. First quartile Q1 contains the first 25% of the data, second quartile median divides the data into two equal halves and the third quartile Q3 contains the last 25% of the data. The inter quartile range defines the spread of the central half of the data. The inter quartile range of the food retailers is £2.61m and that of non food retailers in £1.94m indicating a high spread of central half of the data for the food retailers.
To belong to the highest 25% among the retailers, the retailers should cross the third quartile which contains the top 25% of the data. Hence for the food retailer to belong to the highest 25% should cross the turnover of £4.33m and for the non food retailer should cross the turnover of £2.55m to belong to the highest 25% among the non food retailers. To belong to the highest 25% among all over retailers, they should cross the turnover of £3.5m.
Task B
The scatter plot between the number of employees and turnover for the food retailers is as below:
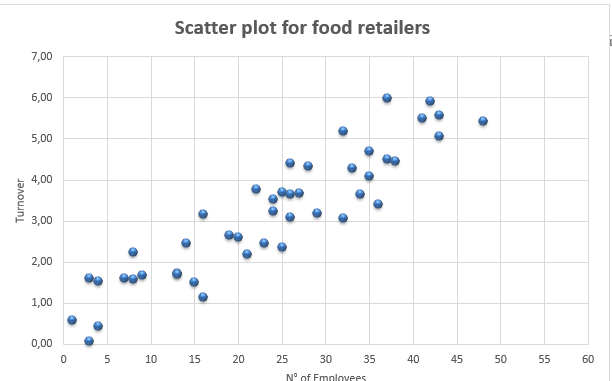
The Pearson’s correlation coefficient for the data is 0.91
The scatter plot between the number of employees and turnover for the non food retailers is as below:
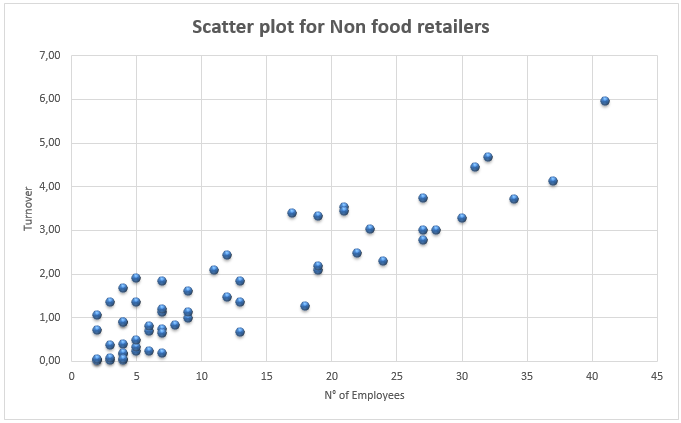
The Pearson’s correlation coefficient for the data is 0.91.
The general linear model of the regression line is given as Y = a + bX, where Y is the dependent variable, X is the independent variable, b is the slope parameter and a is the intercept. a and b are determined using the least square method. Using the excel functions, b = 0.11 and a = 0.554. Hence the linear model for the relationship between the turnover and the number of employees of the food retailers is Y = 0.554 + 0.11X
The slope and intercept parameters for the non food retailers are b = 0.122 and a = 0.093. Hence the linear model for the relationship between the turnover and the number of employees of the non food retailers is Y = 0.093 + 0.122X
For 17 employees, the turnover for Food R US will be (0.11) (17) + 0.554 = £2.424m
For 6 employees, the turnover for April Tools will be (0.122) (6) + 0.093 = £0.825m
Memo
SUVEDUKA Consultancies, UK 06/11/10
To: Joseph Rosen, Islington Business Center
From:
Subject: Analysis of turnover of retailers
The scatter plot of the food retailers reveals a positive strong linear relationship of turnover over the number of employees. The diagram seems to be perfectly linear and spread of the data is symmetric over the line. Hence increase in the number of employees in food retails will increase the turnover. The correlation coefficient also reveals this fact. The correlation coefficient is 0.91 which is close to 1. Hence the relationship is strong positive and linear.
The scatter plot of the non food retailers also shows a positive strong linear relationship of turnover over the number of employees but increasing trend is less than that of the food retailers. Also the spread is not symmetric over the trend line and the spread is higher at lower ends. The correlation coefficient is equal to that of food retailers of 0.91 (Renze and Weisstein).
There are some outliers in the retailers, the 82nd data of food retailer over performed with turnover £5.98m and 90th data of food retailer under performed with £0.07m. For the non food retailers, the 49th data over performed with £5.96m and the non food retailers of 8th and 60th data underperformed with turnover £0.01m.
The linear model for food retailers is Y = 0.554 + 0.11X. Here 0.11 is the gradient parameter interpreted as the increase of turnover per unit of increase in the number of employees. Each additional increase of one employee will lead to increase of £0.11m in the turnover as the unit of turnover is £m. The intercept parameter 0.554 is interpreted as the annual turnover of the food retailer where the number of employees is zero. Effectively it is the turnover without the use of employees.
The linear model for non food retailers is Y = 0.093 + 0.122X. Here 0.122 is the gradient parameter interpreted as the increase of turnover per unit of increase in the number of employees. Each additional increase of one employee will lead to increase of £0.122m in the turnover as the unit of turnover is £m. The intercept parameter 0.093 is interpreted as the annual turnover of the food retailer where the number of employees is zero. Effectively it is the turnover without the use of employees.
The prediction for Food R US food retailer is £2.424m for 17 employees and the prediction for April tools non-food retailer is £0.825m for 6 employees. The reliability of the prediction depends on the goodness of the fit of the linear model. The goodness of fit can be determined using the coefficient of determination. The coefficient of determination defines the total variability explained by the model. Here both the retailers model have 83% coefficient of variation. A score above 90% is more reliable. Hence further analysis using tools like ANOVA are recommended to find the reliability of the model for predictions.
Copy to:
Pierre Van Hojdonk, business advisor, Islington Business Center.
Conclusion
From the analysis we conclude that the food retailers have higher turnover than the non food retailers. Also the number of employees affects the turnover. Hence there must be necessary actions to increase the turnover of the non food retailers by increasing moderately the number of employees for non food retailers and less for food retailers as the dependency is less for food retailers.
Appendix A – Formulae
The following table gives the formulae used to get the descriptive statistics.
Note: Formula with {} indicates, array formula, entered in excel by pressing Crtl+Shift+Enter.
Appendix B – Tables and Graphs
Table 1 – Frequency table for number of retailers.
Table 2 – Frequency table for number of employees.
Table 3 – Descriptive statistics of turnover.
References
Freund, John E f., 1999. Mathematical Statistics. 6th edition. Boca Raton: Prentice Hall International.
Renze, John and Weisstein, Eric W., Scatter diagram From Math world – A Wolfram Web Resource. Web.
Weisstein, Eric W. Standard Deviation. From Mathworld – A Wolfram Web resource. Web.