Introduction
Scarcity of water is increasingly becoming a problem for most countries in the world. It is estimated that by 2025 a very large proportion of the world population will experience physical as well as economic water scarcity. Physical water supply is the supply of water for personal use and the minimum level is put at 1000m3 by the international Water Management Institute. At the moment, Australia has surpassed this threshold but the water situation there is changing fast (Cida Policy Statement, 2004, Para 1).
Australia exhibits extremes with respect to water resources. Water is relatively scarcer in the most populous areas especially the south while the less populous north is relatively more water abundant. Northern and southern Australia experiences seasonal climate which means that rains are only experienced in a few months only (Connected Water n. d p2).
Australia receives a little over 1% of the world’s water runoff yet its landmass is about 5.6% of the world’s landmass. The unpredictable rain received makes the water resources very vulnerable (Climate Change and Water in Australia, n. d).
However issues of water scarcity relate to both the availability as well as the usage elements. Previous governments over allocated water to various use negatively impacting on the various water bodies and the environment. Irrigation has over the years been encouraged by successive governments while urban consumption continues to rise with increased urbanisation and consequently more development projects. Continued population growth is one main factor that leads to increased water usage especially indirectly through increased irrigation fed agriculture to meet the increased food requirements, industrial and construction development all aimed at expanding the product base to cover the needs of the additional people (Naomi n. d, Para 4).
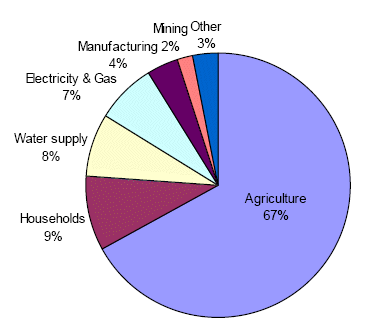
Despite the foregoing, Australians are among the highest water consumers per head in the world. On average they use 1.31 mega lifters per person annually. The amount is split in several areas of application including commercial, agriculture and urban purposes. Agriculture is however the largest consumer taking between 67% and 75% of the total usage yet only 1 %( about 2 million hectares) of the total Australian landmass is under irrigation.
Water usage in Australia
The surface water catchments have a runoff volume of 391,661 giga-litres (GL) per year. Currently about 26% of this water is diverted for human use. This is way above the 20% recommended by environmentalists to maintain Australian ecosystems. Ground water has not been spared. The strained surface water resources have necessitated the need to utilise underground water. An annual increment in water usage of 5,000 GL was observed between the year 1985 and 1997 (The Allen Consulting Group, 2007 Para 4).
Considering the foregoing, the need to properly and economically manage water catchments and water usage by residents is critical. Various countries across the world adopt various mechanisms to manage water. Some invest heavily in recycling while others concentrate on managing the consumption levels to ensure that they are at per with supply levels. This paper explains the restrictions adopted by Australia in comparison with the pricing policy proposed by environmental economists.
Water Restrictions in Australia
Australia faced with growing scarcity has improvised ways of managing water usage. All the cities have different water management schedules to rationalise water usage in line with the prevailing climatic conditions and the amounts available in the water resources.
Restrictions range from prohibitions to the use of sprinklers, watering of lawns, washing of vehicles, swimming pool water levels and watering of pavements. Depending on the location and the unique features of the cities the various authorities have different schedules. The different levels of restrictions are called stages. There are a total of 8 stages each different for each stage. Stage 1 is the least restrictive while stage 8 is the most restrictive (The Allen Consulting Group 2007, Para 4).
Depending on the climate the authority in each respective city does an analysis and comes up with a report on the water situation upon which a decision on which stage the city should run is made.
Due to climate change and persistent drought, certain big Metropolitans have permanent restrictions imposed on the residents. Cities like South Australia and Victoria have some permanent restrictions though they are commonly unnoticeable due to the extra temporary restrictions imposed. The permanent restrictions are on activities such as daytime use of sprinklers. They are mainly meant to enhance responsibility in using water as opposed to curtailing water use. Estimated water savings due to permanent restrictions ranges from 4% to 9% (Brown 2002, p2).
Temporary restrictions mainly target residential and non- residential users. The schedules incorporate the time, type and method in which water is used. Restrictions on method of use is mainly on method of use is mainly to minimise on wastage. Use of sprinklers may be banned but buckets allowed because buckets are less wasteful. It should be noted that most restrictions are on water sourced from the mains (Institute of Sustainable resources 2009, Para 2).
Education and raising awareness have been central to the success. “Water inspectors” survey areas to oversee compliance and may impose penalties in confirmed cases of non-compliance ranging from warning to fines (Mindy 2009, Para 4).
Weaknesses of Restrictions
Environment Economists have come out to strongly oppose the Australian method of conserving water. According to Allen Group Consulting, restrictions do not balance demand and supply. They simply impose extra costs on the users. The entire users in a region bear the inconvenience of the restrictions regardless of the fact that some may have a higher value for water than others and as such may be willing to pay more than others (The Allen Consulting Group 2007, Para 6).
Restrictions come with additional costs of administration due to the need for enforcement and investment in alternative water sources by residents and businesses in purchasing water tanks and drilling boreholes. Other costs include foregone recreations, inconveniences due to the timing of use as well as reduced demand for certain products and services such as landscaping. All these costs are borne by the community yet they are not factored in performing the cost benefit analysis of the restrictions. The only costs incorporated in the analysis are the potential costs that could result in future due to reduced water volumes. This means the water is highly under priced in Australia (Charters and Williams, 2007 p6).
Social Cost Model
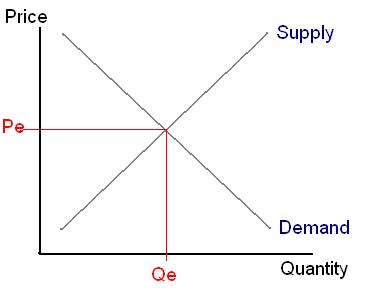
A normal good operating in a free market has its price determined by the market forces of demand and supply as demonstrated below.

The graph shows that the equilibrium price is achieved at the point where supply and demand curves meet. The Price Pe is determined in the market by both forces of demand and supply. In the water market, the supply cost is determined only using the costs incurred in supplying the water.
The current price of water in Australia does not incorporate the social cost of water meaning that it has lead to larger quantities of water (Qe) which is higher than the recommended being consumed. This is what has lead to the imposition of the restrictions.
A proper analysis of the supply curve incorporating the social cost brings a different scenario. The added costs of availing water caused by the foregoing factors would result in an upward shift of the supply curve. This is due to the fact that each unit of water will be supplied at a higher price than the previous price. Graphically, this can be shown as:
In the graph the upward shifting of the supply curve results in a higher equilibrium price. This new higher price results in lower quantity being demanded. Anyone who can afford the high price will buy as much quantity as he can but in the process pay a lot more than those whose demand is less.
Applying this concept to water provision in Australia can present immense benefits. The price of water is clearly under priced.
First, the administration costs would drastically reduce as no water inspectors would be required to enforce restrictions. The incentive to use less water will not be from the authority but from the prohibitive pricing.
Clearly, Australians are willing to pay more to avoid the restrictions. A survey conducted by the center of international economics in 2005 in some capital cities confirmed this. In Sydney, households were willing to pay in the range of $297-$1154 million per annum. In Melbourne, they were willing to pay between $238 and $923. The estimates of all the cities summed up equates to between $0.8 and $3.1 billion per annum. All these are currently not taken into consideration when pricing water today (Mindy 2009, Para 5).
Indeed, restrictions are very expensive. A study done in Canberra by ACTEW Corporation on stage three restrictions showed that the program saved 143kL per household. $360 was the average spending equating to $2.5 per kL of water saved without the administration costs. Desalination of salty water costs $1.20 and $2.20 per kL yet the supply is unlimited (The Allen Consulting Group, 2007 Para 8).
Despite these costs, governments continue to use restrictive measures to control the supply side of the commodity.
The biggest challenge to adopting the social cost model for many governments is the difficult in pricing. Normal goods are supplied to the market and sold at market defined prices. The prices are easy to determine fairly as there exists many buyers and many sellers. The water market is monopolistic. City authorities are the sole vendors of the commodity to numerous customers. The authorities are the only ones mandated to develop the infrastructure for water supply due to the high fixed costs involved and the costly results of duplicating infrastructure. In this case they alone determine prices (The Allen Consulting Group, 2007 Para 10).
Absence of market determined prices poses a challenge to the authorities. It is not very clear which method to use in pricing the water.
Certain criteria can however be applied to determine a fair price for the water. First the price set by the water vendors should enable them to fully cover the costs incurred in supplying the water. Secondly, the price should take into consideration the scarcity element. This is done by setting a price equal to the cost of servicing an additional demand unit in the long run. This involves setting the price in line with the long run marginal cost of supply. This provides an incentive to invest in additional supply of water and bill the customers based on a more accurate analysis. As a golden rule prices should reflect the full costs and benefits when and where they occur (Michiel 2003, p4)
The marginal cost should rise with the onset of severe climatic conditions so as to take care of immediate plans put in place to access more water in the short run.
Conclusion
The Australian restriction method is an expensive way of managing water. Some significant costs are not taken to account in assessing the cost of restrictions. Even though responsible water use should be encouraged as a moral or ethical issue, some people may be willing to pay more for water even if their usage may be considered as wasteful. Pricing of water should thus consider the presence of differences in preferences of the various customers (Cida Policy Statement 2004, Para 5).
However a major challenge in the water market is the fact that water is a basic necessity. Governments are charged with the responsibility of ensuring every person accesses water. The idea of pricing water highly to match demand and supply presents a collision point between politics and economics. It may be economically correct to adopt the social cost method but politics dictate otherwise. No leader of government would be willing to implement a system which seems to favor the rich while the relatively poor struggle to access water. This is tantamount to political suicide hence the resistance. Nevertheless, not following the social cost model continues to result in major inefficiencies in the water management system and may not lead to the desired effect in the long run.
Reference
Brown Lester. “Eco-Economy Indicators,” Earth Policy Institute (2002). Web.
Cida Policy Statement. “Managing Australia’s Water Resources: A New Approach,” Committee of Economic Development In Australia (2004). Web.
Climate Change and Water In Australia.” About Water In Australia,” (n. d). 2009. Web.
Charters, Colin and Williams John. “Can Australia Overcome its Water Scarcity Problems?” Journal of Developments in Sustainable Agriculture (2006), Web.
Connected Water. “Water Scarcity and Demand” (n. d), Web.
Institute of Sustainable resources. “Review of Water Restrictions,” (2009). Web.
Mindy Lubber. “Growing Business Risks from Global Water Scarcity” Leading Green (2009). Web.
Naomi Carrard. “Case Study of Australia,” Australian Mekong Resource Centre.
University of Sydney (n. d). 2009. Web.
The Allen Consulting Group. “Saying goodbye to permanent water restrictions in Australia’s cities,” (2007). Web.
Wind Michiel. “Environmental Economics and Water Management,” Eco-consult Environmental Economics (2003), Web.