Abstract
This paper demonstrates the use of real financial data in financial analysis in decision-making for potential investors. The objective is to carry out a broad financial analysis for ENGlobal Company. It explores the various techniques and tools used for financial analysis. In the analysis, we use financial data from ENGlobal Company. The study is based on a comparative analysis of historical data on the capital of ENGlobal Company.
The study concentrates on statistical highlights of this Corporation’s ratio analysis (equity debt, and gearing levels) and their relationship to financing. In addition, percentages are used in the analysis to monitor changes over time. Graphs are also used to portray the trend of various variables in the study throughout the analysis. The analysis majorly concentrates on financial statements for a defined period from which comprehensive inferences are made to reflect on the financial performance and position.
Acknowledgment
Thanks to God for granting me the chance and the ability to complete this work. I wish to express my earnest gratitude to my lecturers for their valuable advice and guidance in this work. Special thanks to my fellow students, family, and friends for their eminent support of this work.
Declaration
I hereby declare that this work is the result of my research except as cited in the reference. The work has not been submitted previously, in whole or in part, to qualify for other assessments. It is the result of my research as a whole.
Financial analysis of ENGlobal Corporation
Executive Summary
This research treatise explores and explicitly identifies financial performance in ENGlobal Company with the intent of identifying company position as reflected in financial statements. The company in question is the ENGlobal Company based in Houston. This analysis attempts to reflect on the financial analysis to make an informed deduction on the nature, structure, and form of capital capacity, operative profitability, and investor confidence.
Over the last seven months, earnings per diluted shares at ENGlobal have increased by 74% to 0.05$. However, total revenues decreased by 2% to $79.8 million. Interestingly, the consolidated Gross Profit Margin experienced an increase of 7.8% when computed as a percentage of total revenue. The company recorded a gross profit of $8.5 million in the last quarter financial year indicating an overall increase of 33%. In addition, the company realized a $2.0 million in adjusted EBITA from daily operations besides the non-operational items.
Background
Industry Overview
The Independent Project Analysis (IPA) industry has been active in offering consultancy services in global capital projects across the continents. Often, the players in this industry are mandated by their clients to offer extensive and professional onshore and offshore research on megaproject commissioning and development. Over the past decade, the industry has registered steady growth and the same is projected to grow further with the projected decline in a global recession.
The growth rate for this industry was paced at 30% per annum in a study conducted in 2009. The key players in this industry include engineering firms, construction resource consultants, and suppliers. However, the industry has to cope with commodity prices rebound due to inflation in vital materials such as metals and oil. Thus, the current economic feasibility positioning largely depends on the primary drivers of the industry who are the emerging economic regions of India, China, Africa, Brazil, and the Middle East.
Back Ground and History Organization of Management
The global ENGlobal Nasdag ENG Company was established in early 1985 as a service provider in project solutions delivery across the United States and beyond the US borders. The company is divided into three main segments. These segments are field solutions, automation, engineering, and construction. Currently, the company has 2100 employees and is based in Houston. The management team consists of the president and senior vice president who handle the business development role. Over the years, the company has recorded steady growth and financial performance.
Products
The company is divided into three main segments. These segments are field solutions, automation, engineering, and construction. The Engineering and Construction department of ENGlobal Company offers turnkey execution, management, and development of several global engineering projects. The field solutions segment is active in project management and logistics involved in staffing, permitting, site acquisition, legal outreach, and regulatory aspects of service delivery. In addition, this segment provides services on inspection of project sites. The last segment is the Automation segment which offers design, program assemblies, installation, integration, and analytical control services.
Marketing and Distribution Channels
The marketing and distribution channels of ENGlobal Company are highly integrated into a flexible but efficient system. Their performance records and recommendations from several satisfied clients have always been a strong point in furthering expansion capacity. The company has an active marketing team and a bank of competent professionals. To remain competitive in the dynamic market, the company has managed to stand out in quality and competitive price structure. The company is divided into three segments with each segment operating independently but is simultaneous to one another. In addition, marketing is mainly controlled by a series of recommendations from the government who is one of their key customers.
Competition
The major competitors of ENGlobal Company are the Aecom Technology Corporation, Alliant Techsystems, Atronics Corporation, and Ducommun Incorporated. However, the company is very stable at 3.57% in the competitive index. Competition is mainly influenced by company positioning and the intensity of projects competed against quality as recommended by clients. Due to high quality in service delivery, coupled with competitive pricing, ENGlobal Company has managed to survive the competition and is undisputedly one of the leaders of this industry. Since the company has diversified its operation, it has managed to survive and remain profitable in the dynamic industry. As indicated in the NASDAQ: ENGlobal Corporation (ENG) Company Financials website:
ENGlobal Corporation (NASDAQ: ENG), a leading provider of energy-related project delivery solutions, announced today that it has postponed the announcement of its fourth quarter and fiscal year 2011 results originally scheduled for March 30, 2012. Management has been focused on repositioning our credit structure to provide ENGlobal with additional operational flexibility. (“NASDAQ: ENGlobal Corporation (ENG) Company Financials” par 2)
Production Facilities
The company has over 2100 employees distributed across its eleven offices. This team offers services in construction, consultation, installation, service delivery, and site inspection services. The company has vast facilities and qualified personnel for its segments. Among the three segments of the company, the most active the Engineering and construction.
Historical Financial Statements
In 2010, the total revenues amounted to $320.6 million which is 68.6% of the total sales with the Engineering segment contributing 30% of this value. It further points out that, ENGlobal Corporation has the market all over the world with major markets being China, the USA, India, and some part of the Asian continent. America is the major market. There has been no change in the capital structure for the corporation over the last ten years. The table below shows a summary of the financial performance of ENGlobal Corporation for a five-year period from 2006 to 2010.
Summary of financial performance from 2006 to 2010
Table 1.0 (All the amounts in this study will be in Dollars unless otherwise indicated)
Notes to Consolidated Financial Statements
The steady performance as indicated above is as result of operational management strategy involving projections and follows up for the same in financial management.
Trends in Growth and Variability
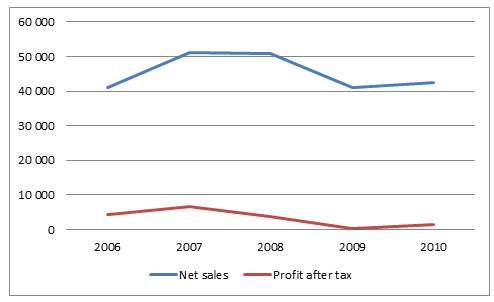
From table 1.0 above, it is evident that ENGlobal had an erratic performance over the five year period. In the face of declining performance, the corporation did not report loss in any of the years. Sales peaked in 2008 with a high of $18,258 and went as low as $12,233 in 2010. Profit after tax for Nokia declined immensely in 2009 to $93 million. In 2008, it reported a 42.4% decline in profit after tax and in 2009 it decline by 13.3%. Despite poor performance reported from 2009, the Corporation paid a steady dividend with a range of 0.13 per share over the five year period (“NASDAQ: ENGlobal Corporation (ENG) Company Financials” par 3). However, earning per share declined with the poor performance. The graph below show trend of net sales and profit after tax for the five year period.
Ratio Analysis
Ratio analysis is important in financial analysis. “One key area of financial analysis entails extrapolating the company’s past performance into an estimate of the company’s future performance in the market” (“NASDAQ: ENGlobal Corporation (ENG) Company Financials” par 2). Thus, it is important to infer current performance of the company into projected future performance. Besides, the same analysis should incorporate the aspect of time value. Thus, this section will basically dwell on analysis of financial statements of ENGlobal Company using several ratio analyses such a profitability ratio, liquidity ratio, Return on Equity, and Return on Investment.
Analyses
Initial Pro Forma Statements
The ability of accompany to function and earn income in the process is called profitability. Besides, profitability is realized when a company can earn income while at the same time is in a position to sustain growth in long term, midterm, and short term. In order to analyze the initial pro forma invoices, it is critical to reflect on ratios such as operating profit margin, gross profit margin, net profit margin, the return on equity ratio (ROE), and the return on assets ratio (ROA).
Thus profitability of ENGlobal Company can be critically analyzed by explicitly reviewing expenditure and income account. Critically, several ratios are analyzed simultaneously and computed to present a vicious view of the company’s profitability in the 2006-2010 financial periods. The table below indicates a comprehensive table showing the initial pro forma invoice between 2006 and 2010 for ENGlobal Company.
Table 2.0 of profitability ratios.
Table 2.0.
Indicate below is a comprehensive graph of returns on Assets, Profit Margin, Gross profit margin, and Returns on Equity.
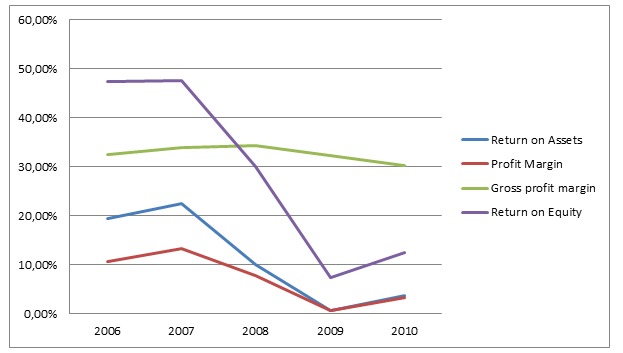
Table 3.0 Equity ratios.
Calculation of Cost of Capital
Liquidity Ratio
Comprehensive analysis of liquidity of a company is essential in determining the overall ability of a firm to maintain and check positive cash flow in a dynamic market while at the same time meeting its immediate obligations and targets comfortably. The state of being in a position to meet immediate obligations is called the cash availability to settle debt. In order to compute liquidity ratio, it is vital to put into consideration the aspects of liquid assets and cash flows as reflected in the capital structure and operational profitability. By definition, Liquid assets are those assets which can be traded actively in the market and can easily be converted into liquid cash depending on the market price at the time of trading in them. In order to analyze liquidity of ENGlobal Company, concentration is directed towards comprehensive study of the quick and current ratio. The table below shows liquidity ratio of ENGlobal Company between 2006 and 2010 financial years.
Table of liquidity ratios
Table 2.1.
As indicated in the above table, current ratio of ENGlobal Company ranges from 0.05 in 2010 to 1.4 in 2006. Also, the quick ratio ranges from 2.13 in 2010 to 1.81 in 2007. The liquidity ratio is above one except in 2010 (“NASDAQ: ENGlobal Corporation (ENG) Company Financials” par 2). This is an indication that ENGlobal Company has good and steady liquidity ratios and is in a comfortable position to meet all its immediate obligations as the rates range within the ideal limits. In the financial markets, the ideal quick ratio is 1:1 and that of current ratio is 2:1. However, the ideal values are dependent on industry ratio at the time of computation.
Determination of The Weighted Cost of Capital
Annual Balance Sheet
Market Value of the Firm’s Equity
As indicated in the above table, it is apparent that the company’s market value of Equity has increased from 2007 at $55,797 to $78.711 in 2009. However, the same decreased to $65,102 in 2010. Besides, retained earnings have increased steadily from 2007 through to 2009. However, the same reduced in 2010. The graph below indicates the efficiency ratio.
Market Value of the Firm’s Debt
The market value for ENGlobal Company increased from $63, 737 in 2007 to $75,939 in 2008. Interestingly, this value suddenly decreased to $31,924 in 2009 before increasing again to $45, 222 in 2010 (“NASDAQ: ENGlobal Corporation (ENG) Company Financials” par 2). This is a clear indication of a strong capital structure noting that total liability is below the total worth of the company throughout the analysis.
Debt to equity ratio
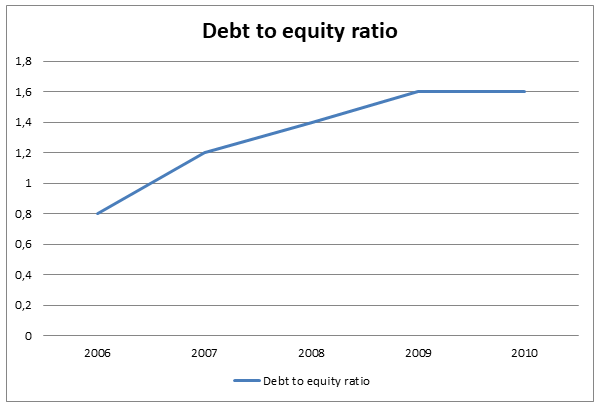
This ratio quantifies the existing relationship between funds provided by creditors and funds in form of capital invested by investors and owners of a firm. Higher debt to equity ratio is a sign of greater risk on investment especially to future and current creditors (Vance 67). On the other hand, lower debt to equity ratio quantifies financial stability and a higher probability of positioning to survive in the current and future business environment. Besides, a lower ratio defines a better position to borrow with an assurance to creditors of repayment. When this ratio is too low, it could signify conservativeness in financial decision-making as very rates may mean that the management team is afraid to take a risk and let the business operate within the optimal limits (Francis 13). The table below shows the interaction between debt and equity in ENGlobal Corporation between 2006 and 2010.
Table 2.2.
As indicated in the above table, it is apparent that the debt to equity ratio has been experiencing a mix of increase and decrease between 2006 and 2010. The figure was lowest in 2009 at 0.09 and increased slightly in 2010 to 0.33 (“NASDAQ: ENGlobal Corporation (ENG) Company Financials” par 2). This is an indication of decreased risk to current and future creditors since the figure has been steadily declining over time. Therefore, the fear of volatility in earnings may not be major in investment decision since the additional expense as a result of increased expense is negligible. The graph below indicates the relationship described above.
Investment Decision
Discounted Cash Flow Assumptions
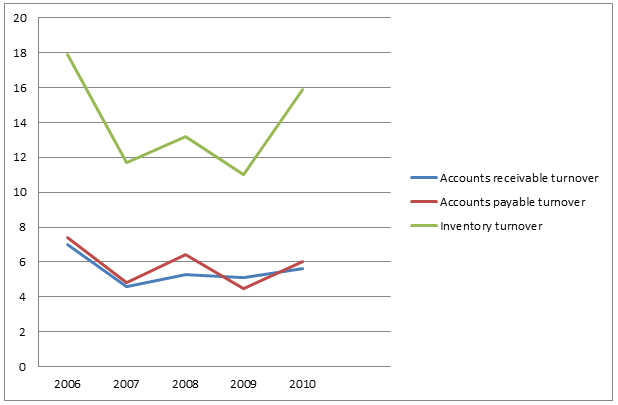
Discounted cash flow assumption lies on the concept of efficiency which is an indication of management capacity and resource utilization to generate projected returns (Fahey 67). In addition, this concept indicates the level of activity as show in the turn over ratios. The higher the turn over, the better position a company is in terms of capital structure and expansion capacity. As indicated above, there has been a steady increase in the turnover of ENGlobal Corporation over the five year period.
Financial Decisions
External Options
External factors that may influence the decision of investors in this industry would be market swings and political stability because this company is actively involved in mega projects in the Asian continent which often experiences a case of political instability. At present, the projected economic climate is favorable for long-term investment since the industry has been steadily expanding in the last decade.
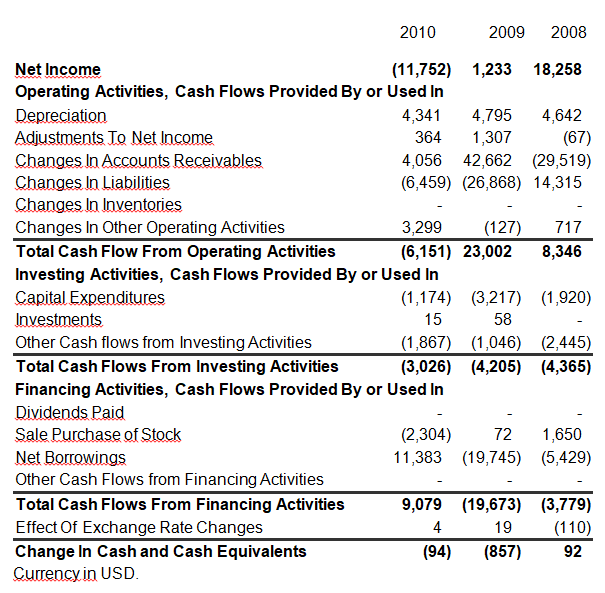
Internal Options
The internal option available for ENGlobal Corporation is assimilation and better research on the best pricing models to counter major players in the industry. Since the capital structure is very stable and profitability reliable, the company is safe at least in short term. Besides, the company’s performance is still below optimal level hence presenting a room for expansion noting that the cash flow from financial activities has moved from negative to a positive value of 9.079 million dollars as indicated in table 2.3
Ratio Analysis
From the analysis of profitability, return on equity, return on assets, and efficiency ratios, it is apparent that the performance of this company is predictable and very stable. Thus, creditors and investors are not only safe but are assured of returns on their investments in the short and long term.
Current Capital Structure
The current capital structure is characterized by a balanced assets and liabilities ratio. This is a desirable positioning advantage to service in the competitive environment. Besides, the current capital structure allows for expansion of the business since it is very profitable and operates below the optimal level.
Sensitivity analysis
Sensitivity analysis touches on the comparison of historical data of a company, level of efficiency, response to market swing, internal weakness, financial gearing, and liquidity (Vance 45). As indicated in the above financial analysis, ENGlobal Corporation operates in a competitive market that expands steadily. The market is sensitive to inflation and its effect on the foreign currency exchange rates. This is indicated by dismal performance in 2009 associated with the global depression of early 2009. From the ratio analysis, it is apparent that the company is in a steady position to benefit from competitive advantage, while at the same time expanding without serious difficulties as it has displayed consistency in performance over the years. Despite the low start, the company is in a process of resuming optimal performance as noted in the stability of its returns and capital structure.
Summary and Conclusion
The nature of a company defies its financial position. Comprehensive analysis of the financial performance of a company like ENGlobal may prove complex because it operates more than one segment existing independently of the other. As indicated in the above analysis, it is apparent that the profitability of this multinational company has remained steady despite slight variances noted across the five years. Despite dismal performance in 2010, ENGlobal Corporation has exhibited steady capital structure and dividend though earnings per share declined. Reflectively, due to strategic position, the company was in a position to meet its current obligations every year.
The steady and lower rates of equity are an indication of stability which in turn is an assurance to creditors and investors of the company’s creditworthiness. Notably, the debt to equity ratio remains low and within the ideal despite the slight inconsistency incorporation efficiency in balancing net worth and total sales. At present, the current positioning of the firm can be extrapolated and used to make future forecasting because of consistencies in profitability and operations efficiency. In addition, its current capital structure guarantees potential investors and creditors high return rates on every investment. Therefore, as reflected in the comprehensive financial analysis, the company is viable and safe to invest in. Besides, it has a stable capital structure that can support expansionary investments with short-term and long-term positive returns.
Appendixes
Table 1.0 Summary of financial performance from 2006 to 2010.
Table 2.0 of profitability ratios.
Table 3.0 Equity ratios.
Calculations formulas
- Cost of debt = Risk free rate + Default spread
- Return on Assets = Net profit / Average Total Assets
- Net Profit Margin = Net profit / Net Sales
- Gross profit margin = Gross profit / Net sales
- Return on Equity = Net profit before taxes / Net worth
- Current ratio = Current assets / Current liabilities
- Quick ratio = Quick Asset / Current liabilities
Works Cited
Fahey, Liam. Competitors. New York: John Wiley & Sons, 1999. Print.
Francis, Claus. Corporate financial analysis with microsoft excel. New York: McGraw-Hill Companies, Inc, 2010. Print.
Helfert, Erich. Financial analysis, tools and techniques: Assessment of business performance. New York: McGraw-Hill books, 2001. Print.
NASDAQ: ENGlobal Corporation (ENG) Company Financials 2011. Web.
Vance, David. Financial analysis and decision making: Tools and techniques to solve. United States: McGraw-Hill books, 2003. Print.