The case of Pringly Division presents a management decision that managers have to face in their strategic planning roles. The decision made should be favorable to the company and to customers. Companies are in business to make profits and maximize on shareholders wealth. The senior management of any company are the agents who foresee the day to day running of the business. The managers should make informed decisions supported by figures.
The facts of the case require the management to make a pricing strategy for a new product and determine the probable sales for the product. This is because the previous sales from new products never met the required sales target. This led to lower revenues for the company due to low sales. There are two strategies under consideration.
Strategy one
Some of the senior managers believe this is the best strategy to employ as it leads to cost reduction. The second strategy is in form of marketing. Some managers believe that to drive the profits of the company, an advertising and promotion strategy will be effective. The strategy is as follows;
The marketing department supports this strategy as it emphasizes on the need for greater dissemination of information to consumers. The below calculation will show the best strategy to employ to increase on sales and profit of the company.
Break – even point (BEP)
Atkinson (1997) states that “break-even point is the volume of sales where the company neither makes profit nor loss. At this point revenues and total costs are equal. For every unit sold above the break-even point, profit will increase by an equivalent quantity of the contribution per unit. The sales revenue covers all the variable costs and fixed costs” (p. 108). The BEP analysis aims at determining the least amount of units that an entity must produce and sell to remain in business. When a firm trades at a level below the BEP, it makes losses. The BEP will assist senior managers of Pringly make an informed decision regarding the pricing strategy for the new product. The cost of producing a product determines the pricing of the product. It is essential to determine what amount of costs will help to break even. The starting point will be to use all the selling price options to determine the total sales.
Break-Even for the first strategy;
Total sales revenue:
![]()
Contribution Margin;
![]()
Profit margin:
![]()
Contribution margin:
![]()
Break – Even point:
![]() units
units
Break – Even point for the second strategy
Total sales revenue;
![]()
Contribution Margin:
![]()
Profit:
![]()
Contribution margin:
![]()
Break Even point:
![]() units
units
Yes, the organization can possibly attain the target benefit of $4,000,000. From the accompanying computation it would be clear at what units the organization can attain the focused profit or more.
First Strategy
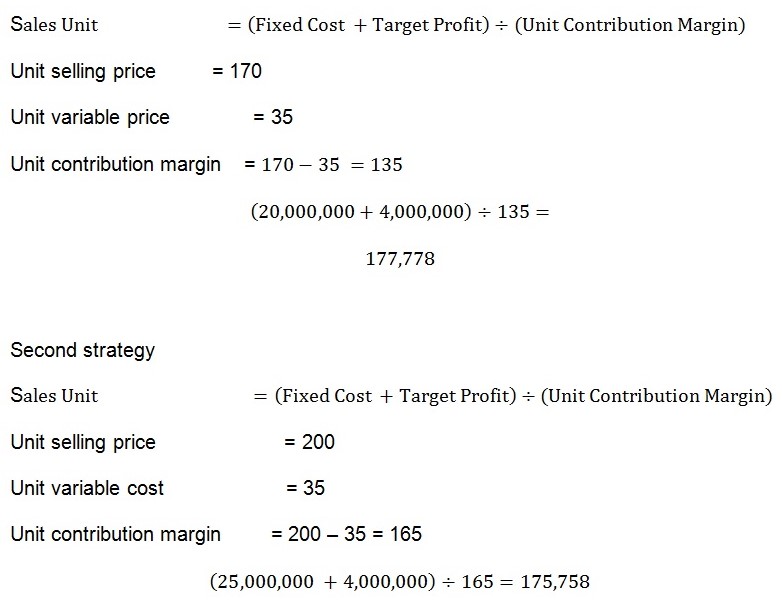
From the calculations, to achieve a profit of $4,000,000 while using the first strategy, the company should sell 177,778 units. When employing the second strategy, then the company should sell a minimum of 175,758 units of the product. The calculations help in decision making where there exists disagreement and help in unravelling the most difficult relationships in an organization. The break – even point is essential and helpful when determining the prices of the new product as it highlights the relationship in prices, size and revenue of the product. This is important in establishing the income earned to get to the point where no profit nor loss is incurred.
Margin of safety (MOS)
“This is refers to the amount of sales that is in excess of the break even sales volume. It states the extent to which sales can drop before losses begin to accrue in a firm” (Atkinson, 2013, p. 73).
The calculation of MOS is as follows;
![]()
![]()
First strategy:
- Sales price – $170
- Variable costs – $35
- Total fixed cost – $20,000,000
- Budgeted sales – $177,778
![]()
![]()
Second strategy:
- Sales price – $200
- Variable cost – $35
- Total fixed cost = $25,000,000
- Budgeted sales – 175,758
![]()
![]()
From the above calculations, the margin of safety for strategy one is 29,630 while that of strategy two is 24,243. This means that if the company sells below 29,630 for strategy one and 24,243 for strategy two, it will be making losses. This sales units should not fall below the margin of safety. This sales figure cautions the company against making losses. These figures are above the equilibrium position of the company.
The calculations above support the introduction of the new product as it will be operating above the break-even point. The margin of safety is attainable and will keep the company afloat.
From a management perspective, this analysis is useful to all sizes of companies. When a company has a wide range of products, it should conduct a break even analysis to determine which product is a cost centre and which product is a profit centre. The analysis enables managers to know where to have more resources and where to reduce the company resources. The analysis also helps large institutions to determine the margin of safety. This is essential as it helps the organization to keep stock levels at the required level.
Return on Investment (ROI)
Atkinson (2013) states “Return On Investment highlights the benefits that managers can obtain by decreasing investment in both current and fixed assets. Return on capital invested may compel the management of an exceedingly gainful division to reject investment, which from the perspective of the firm ought to be invested” (P. 79). Return on initial capital invested can be compared to break – even analysis. It describes the gains made from an investment by making a comparison between the profits made and the costs incurred. The analysis of costs versus revenues for Pringly are essential in the determination of the Return on Investment.
![]()
This is as shown below.
From the above calculations, strategy two has a high return on investment. This means that the rate of exchange for the money invested is higher in strategy two than in strategy one. It is recommended that the company should employ strategy two. Strategy two is profitable to the company and its price is sensitive to the needs of customers.
Reference
Atkinson, A. A. (2013). Management accounting. Upper Saddle River, N.J: Prentice Hall.