Introduction
Texas Instruments is based in the United States and was founded in 1930. It deals with the designing, production, and sale of semiconductors. The company sells its products across the globe. The company is the third-largest manufacturer of semiconductors across the globe. It comes third after Intel Corporation and Samsung Inc. Also, it is the second-largest distributor of chips for cellular handsets. The company that leads in the production of these chips is Qualcomm Corporation.
Further, the company leads in the production of digital signal processors and analog semiconductors globally. Therefore, it can be noted that the company is a major global producer of major electronic components. Texas Instruments Inc. is a public company that trades on NASDAQ with the ticker symbol TXN. Further, it is a component of both the S&P 500 and NASDAQ-100 indices. Currently, the company employs about 31,003 employees across the globe. This paper seeks to carry out a comprehensive financial analysis, planning, and forecasting over a period of four years.
Income statement
The table presented below shows the income statement of the company for a period of 4 years.
Texas Instruments, Inc. Income statement. For the period ended 31st December 2011-2014.
The income statement shows that the total revenue earned by the company dropped between 2011 and 2013. The value reduced from $13,735 million in 2011 to $12,205 million in 2013. In 2014, the total revenue rose to $13,045 million. The drop in performance during the period can be attributed to competition that the company faces in various divisions and business risks. The gross profit margin also followed a similar trend.
The value rose from $6,772 million in 2011 to $7,427 million in 2014. The operating income dropped from $2,992 million in 2011 to $1973 million in 2012. The value later rose to $2,832 million in 2013 and further to $3,947 million in 2014. The improvement in operating income during that period can be attributed to a drop in research and development costs during the period. It can be observed that the net interest income dropped from $42 million in 2011 to $94million in 2014. The decline can be attributed to the increase in interest expense. Other income also rose from $5 million in 2011 to $21 million in 2014.
The income statement further shows that the net income followed a similar trend as operating income. The value dropped from $2,236 million in 2011 to $1,759 million in 2012. The value rose from $2,162 million in 2013 to $2,821 million in 2014.
Further, both the basic and diluted earnings per share also followed a similar trend as net income. This can be attributed to the fact that value is arrived at through the division of net income and the number of outstanding shares. Despite the fluctuations in the value of net income, the dividend per share rose from $0.56 in 2011 to $1.24 in 2014. Finally, average shares outstanding dropped from 1,139.50 million in 2011 to 1,046.60 million in 2014. This can be attributed to the share repurchase exercise that the company has been conducting over the years.
Balance sheet
Texas Instruments, Inc. Balance sheet. As of 31st December 2011-2014.
The balance sheet values fluctuated during the period. The value of current assets rose from $7,828 million in 2011 to $8,230 million in 2012. The value later dropped to $8,019 million in 2013 and further to $7,768 million in 2014. Cash and cash equivalents make up a significant component of the total current assets. The value of total noncurrent assets dropped during the 4-year period.
The value declined from $12,669 million in 2011 to $9,954 million in 2014. It can be noted that goodwill and other intangible assets make up a significant component of the total non-current assets followed by net property, plant, and equipment. The decline in the value of non-current assets can be attributed to the amortization of goodwill and other intangible assets. The total assets dropped from $20,497 million in 2011 to $17,722 million in 2014. The decline in the value of total assets is a bad indication of the going concern of the entity. The overall performance of the company is at risk of decline.
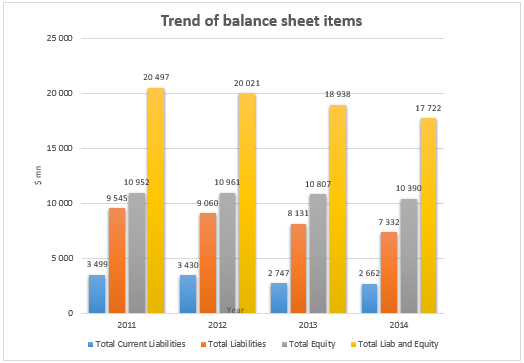
The total current liabilities of the company dropped from $3,499 million in 2011 to $2,662 million in 2014. Further, it can be noted that both current debt and accrued expenses make a significant proportion of the current liabilities. The non-current liabilities also declined from $6,046 million in 2011 to $4,670 million in 2014. The decline can be attributed to the drop in the value of long term debt and capital lease obligation because it makes up a significant proportion of the non-current liabilities. The value of total liabilities also dropped during the period. The value of total equity dropped during the period.
It can be observed that retained earnings, which make up a significant proportion of shareholders’ equity, improved during the period. The value of treasury stock also increased during the period. The value of additional paid-in capital and accumulated other comprehensive loss also improved during the period. Thus, it can be noted that the decline in the value of shareholder’s equity can be attributed to the trend of treasury stock. Therefore, it can be concluded that there was a decline in major balance sheet balances during the period. The column chart presented below shows the trend of various balance sheet values.
Growth rates
The table presented below shows the calculation of growth rates for both and net income.
The geometric and arithmetic growth rates of sales for the company were negative. They represent the top line. The negative sign is an indication that the total revenue deteriorated during the period. It shows that Texas Instruments, Inc. is not perming well enough to generate growth in revenue from key activities of the business. On the other hand, both the geometric and arithmetic growth of net income was positive. They represent the bottom line of the company. The positive values show that the investments that are made by the company are driving the growth of net income. Growth in performance should originate from both the investments that are made by the company and the main operating activities.
Charts
The two charts display the trend of sales and net income of the two values during the period. The value of sales declined between 2011 and 2013 and later rose by a small margin in 2014. In the case of net income, the value dropped from 2011 to 2012 and later rose in the subsequent years.
Ratio analysis
The reported financial statements of a company do not give an in-depth analysis of the financial strengths and weaknesses. Therefore, it is important to carry out further analysis of the results so as to have a better view of the results reported. This will provide a better understanding of the results. Further, analysis of the company helps in making an informed financial decision. It also facilitates the comparison of results for a number of companies.
A tool that is often used to analyze the financial statement is ratio analysis. Ratio analysis breaks down the financial data into various components for better understanding. The role of the various categories of ratios will be discussed in the subsequent section (Abraham, Glynn, Murphy & Wilkinson, 2010). The table presented below shows a summary of various ratios for Texas Instruments Inc. for a period of 4 years.
Liquidity ratios
The current ratio for the company rose from 2.24x in 2011 to 2.92x in 2014. The values of the quick ratio also rose from 1.73x in 2014. The improvement in the liquidity ratios can be attributed to a decline in current liabilities. The improvement shows that the ability of the company to pay short term obligations using current assets improved. Also, it can be observed that the values of liquidity ratios were high.
It is an indication of a sound liquidity position. Analysis of liquidity position is important because it gives information on the ease with which the company is running the business. Extremely low value shows that the company is facing difficulties in managing the daily operations of the business because it cannot meet short term obligations. On the other hand, extremely high values show that investments are not being made wisely. It indicates that a company has a high amount of current assets in its books. This might not be favorable because it shows that a lot of resources are tied into non-income generating activities. Therefore, it is important for a business to maintain optimal levels of liquidity (Graham, Smart & Meggison, 2010).
Efficiency ratios
Efficiency ratios focus on the internal operations of the company. These ratios show the level of activity in a company, that is, how well a company manages resources to generate a high level of sales and returns. There is a direct connection between the asset management ratios and sales. Favorable efficiency ratios translate to high returns. Therefore, it is important for a business to closely monitor these ratios.
The inventory turnover ratios dropped from 3.89x in 2011 to 3.15x in 2014. The decline shows that the number of times that the company replenishes the inventory declined. It shows that the efficiency in inventory management dropped. The values of accounts receivable turnover fluctuated during the period. The value rose from 8.89x in 2011 to 10.43x in 2012. It later dropped to 10.15x in 2013 and rose to 10.47x in 2014. There was a general upward trend in the value of accounts receivable turnover. It shows that the efficiency in selling goods on credit collecting amounts due rose during the period.
However, the decline can partly be attributed to a decline in the value of accounts receivable during the period. The average collection period dropped from 40 days in 2011 to 34 days in 2014. The decline shows that the company takes a shorter number of days to collect amounts due from debtors. It shows an enhancement in the level of efficiency. The fixed asset turnover rose from 1.08x in 2011 to 1.31x in 2014. It shows that the number of sales units that are generated from a unit of fixed asset improved (Graham, Smart & Meggison, 2010). The increase in the value of the ratio is a result of a decline in the value of fixed assets.
The value of total asset turnover fluctuated during the period. The value dropped from 0.67x in 2011 to 0.64x in 2013. The value later increased to 0.74x. Therefore, it can be noted that there was a general increase in total asset turnover. It shows an improved efficiency in the use of assets to generate sales and income. In summary, it can be noted that there was an improvement in the efficiency ratio. However, this can partly be attributed to a decline in balance sheet values.
Leverage ratios
This group of ratios gives more information on the long term solvency of the company. That is, the amount of debt that the company has in the capital structure. This ratio is vital to potential investors because debt has a direct impact on the number of earnings that are attributed to the shareholders. A high leverage ratio is not favorable because it creates high-interest expenses. This reduces the amount of profit attributed to the equity shareholders.
Further, it reduces the ability of the company to attract new capital providers. On the other hand, very low ratios are not favorable because they show that the management of the company is not quite aggressive and thus not willing to exploit the potentials of the company.
Therefore, it is important for the company to maintain a suitable level of long-term solvency ratios. The total debt to long term ratio dropped during the period. The value of the total debt ratio declined from 46.57% in 2011 to 41.37% in 2013. The ratio gives information on assets that are financed debt. A high value of this ratio shows that a high percentage of assets are financed using debt. The decline in the value of this ratio shows that the amount of debt dropped. On the other hand, the long term debt ratio dropped from 29.50% in 2011 to 26.35% in 2014.
Further, the value of long term debt to total capitalization also dropped from 35.57% in 2011 to 31.01% in 2014. Further, it can be observed that the debt to equity ratio and long-term debt to equity ratio followed a similar trend. Thus, there was a decline in the values of leverage ratios of the company. The decline shows that the amount of debt in the capital structure dropped. The decline is significant because as debt reduces, the capital costs that the company incurs also declines. This leads to an increase in the number of earnings that is attributed to the potential shareholders (Graham, Smart & Meggison, 2010).
Coverage ratios
These ratios are important because they give information on the solvency of the company. The time’s interest earned ratio dropped from 71.24x in 2011 to 25.62x in 2012. The value rose from 29.81x in 2013 to 41.99x in 2014. This ratio gives information on the ability of the company to pay interest expense using earnings before interest and tax. The cash coverage ratio dropped from 95.40x in 2011 to 43.46x in 2013. The value later rose to 55.07x in 2014. This ratio measures the amount of cash that is available to pay the capital cost. A decline in the value of this ratio shows that the availability of cash also declined. Even though the values of these ratios declined over the period, it can be noted that they were still high. This shows that the company solvent (Graham, Smart & Meggison, 2010).
Profitability ratios
This category of ratios gives information on the earning capacity of Texas Instruments, Inc. The ratio gives information on how the company makes use of available resources to generate profit. This category of ratios is quite significant to potential shareholders. Shareholders and other stakeholders prefer doing business with companies that have high profitability ratios. The seven profitability ratios exhibited different trends during the 4-year period.
The gross profit margin grew from 49.30% in 2011 to 56.93% in 2013. The increase can be attributed to a decline in the cost of sales. Growth in the value of gross profit margin indicates that the efficiency of the company in managing sales and cost of sales improved over the period. The operating profit margin fluctuated during the period. The value dropped from 21.78% in 2011 to 15.38% in 2012. It later rose to 23.20% and 30.26% in 2013 and 2014 respectively. The growth in the values of operating profit can be attributed to a decline in some of the operating expenses. The increase shows that the efficiency in managing operating costs improved.
The net profit margin, return on assets, return on equity, return on common equity and DuPont analysis of return on equity had a similar trend as the operating profit margin. The growth in total assets shows that the efficiency of the company in the use of total assets to generate income improved. The growth in the value of the ratio can also be attributed to the decline in the value of total assets. Further, the growth in return on equity and return on common equity shows that the efficiency in the use of equity to generate income grew over the period. This shows that the overall efficiency of the company improved.
The values of the DuPont ratio also rose during the period. It implies that the ability of the company to grow the value of return on equity grew. Therefore, the ratios show that the profitability of the company improved with a slight decline in 2012. The growth can partly be attributed to the reduction in balance sheet values and some expenses in the income statement (Graham, Smart & Meggison, 2010).
Economic profit
The calculations of economic profit for a period of 4 years is presented in the table below.
The economic profit of the company captures the difference between the total revenue earned by the company and the opportunity cost of all resources that are available in the company. Therefore, the value of opportunity cost is more expansive than the costs used in the calculation of accounting profit. It takes care of both implicit and explicit costs. The economic profit of the company was positive during the 4-year period. This shows that the company is viable and should continue with operations (Graham, Smart & Meggison, 2010).
Z-score
The table presented below shows the calculation of the Z-score for Texas Instruments Inc.
The Altman Z-score measures the likelihood of a company going bankrupt. A ratio that is less than 1.8 shows that a company is likely to go bankrupt. In this case, the company had high values of Z-score and they improved. This shows a reduction in the possibility of going bankrupt (Graham, Smart & Meggison, 2010).
The Pro-forma financial statements of the company for 2015 are estimated using the TREND function in excel.
Pro-forma income statement
Texas Instruments, Inc. Pro-forma Income statement. For the period ended 31st December 2011-2015.
The calculations show that the net income of the company in 2015 will grow to $3,726 million.
Pro-form balance sheet
Texas Instruments, Inc. Pro-forma Balance sheet. As of 31st December 2011-2015.
From the table above, it can be observed that the total assets will grow slightly to $17,896 million in 2015. The value of total liabilities will be $6,652 million, while equity will be $12,429 million. The sum of liabilities and equity will amount to $19,081 million in 2015. Thus, it can be observed that liabilities and equity will exceed the number of total assets. This shows that there will be no discretionary financing needed for the amount of capital available to exceed the total asset by $1,185 million. The company should plan on investing the excess amount.
Cash flow statement
Texas Instruments, Inc. Pro-forma cash flow statement. For the year ended 31st December 2015.
The common size income statement
Texas Instruments, Inc. The common size Income statement. For the period ended 31st December 2011-2015.
Common size balance sheet
Texas Instruments, Inc. Common size Balance sheet. As of 31st December 2011-2015.
Leverage measures
The table presented below shows the calculations of leverage measures.
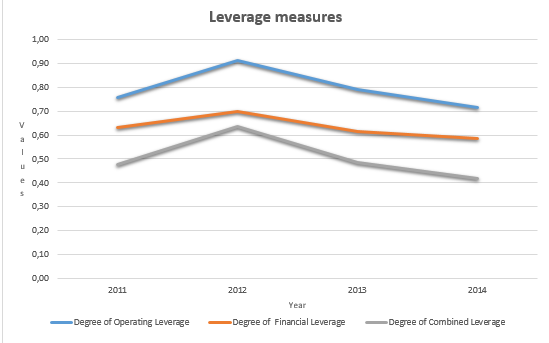
The table above shows the three measures of leverage. The degree of operating leverage gives information on the volatility of earnings before interest and tax as sales changes while other items remain constant. There was a general decline in the value of the ratio with a slight increase in 2012. It is worth mentioning that operating leverage entails the use of a high amount of fixed costs as compared to variable costs. High operating leverage shows that earnings before interest and tax are more volatile. The degree of operating leverage for the company declined. This shows that the company’s earnings are at less risk of volatility.
The degree of financial leverage of the company also had a similar trend as the degree of operating leverage. The decline in the values of the ratio shows that the earnings per share were less sensitive to the changes in the capital structure. Finally, the degree of combined leverage had a similar trend as the other measures of leverage. The decline shows that the sensitivity of earnings per share to changes in sales dropped. Thus, the sensitivity of earnings of the company to changes in sales declined during the period with a slight increase in 2012. The graph presented below shows the trend of leverage measures.
The compound annual growth rate
The calculations of the annual growth rate are presented in the table below.
From the calculations above, the required rate of return of the company is 1%, while the geometric growth rate of dividend per share during the 4 year period is 31.23%.
Free cash flow forecasts
The calculation above shows that the free cash flow based value per share of Texas instruments Inc. is 0.245.
The intrinsic value of stock
Recommendation
Currently, the shares of the company are trading at $56.57. The intrinsic value of the share estimated using the constant growth dividend discount model is $13.248. This shows that the share is trading at a price that is higher than the intrinsic value. It means that the shares are overvalued by 76.58%. In the case of the free cash flow forecast model, the target price of the share is 0.245 while the share is trading at $56.57.
This shows that the shares are overvalued by 99.6%. An overvalued share has a negative margin of safety and that the prices are likely to drop. Investors stand to make a substantial amount of losses when the market prices drop. Therefore, it is recommended that a shareholder should SELL the shares of Texas Instruments, Inc. This decision is also supported by the poor financial performance of the company that is reported in the past four years. Also, the balance sheet values are also declining. It is an indication that the company is likely to make losses in the near future.
References
Abraham, A., Glynn, J., Murphy, M., & Wilkinson, B. (2010). Accounting for managers. USA: South-Western Cengage Learning.
Graham, J., Smart, S., & Meggison, W. (2010). Corporate finance: linking theory to what companies do. USA: Cengage Learning.
Microsoft. (2015). MSN money texas instruments inc. Web.