Introduction
Automobile industry has gone through turmoil in North America and Europe as the recession took a hit at the global economy. The countries worst hit were the US and the major European nations where automakers have seen a slump in auto sales in 2008 through 2009 (Crain 2009). Consequently, the major US automakers like Ford, General Motors (GM), and Chrysler underwent bankruptcy and saw a major slump in the sales figures of their company. The companies, which have been worst hit, are carmakers whose major market was North America like GM and Ford. However, the plight of recession had not crippled the automobile market in Asia and some BRIC (Brazil, Russia, India, and China) nations completely.
Countries like China, India, and other Asian countries and some Latin American countries registered a growth in sales of automobiles even in the recessionary period when the North American and European markets were experiencing a negative growth rate of automobile sales (Thompson 2009). Thus industry wise there has been an observed increase in the sales of automobiles in Asia Pacific region vis-à-vis North America and Europe. Therefore, it is important for GM to determine whether it should increase its market in the Asia Pacific region and to what extent in order to optimize its profit.
General Motors – A Brief Background
Economic recession has served a severe blow to GM, one of the world’s largest automakers. One reason that be observed is economic recession in the US and Europe which had taken a toll on GM sales figures (Thompson 2009). The global sales dropped by 21.8% in the first half of 2009 (Thompson 2009). However, the automakers registered a growth of 37.9% in the Asia-Pacific region and sales in China being an all time high of 61.8% (Thompson 2009).
The North American sales figures look bleak when compared to the Asia-Pacific region, which fell by 37.9% in last quarter of 2009 (Thompson 2009). Further from the financial point of view, the company has earned $238 million from overseas earnings and lost $651 million in North America thus indicating that overseas market for GM is more lucrative than the North American market (Welch 2009). Thus, the question arises, that if GM must concentrate more on the Asia Pacific region where it has earned maximum profit instead of concentrating on the North American market where it is the largest carmaker. Further, sustainability of the growth in the region is an important issue to be studied, so that GM can gauge the opportunity that it will have in expanding in Asia-Pacific market instead of the North American market.
Aim
Given this problem, GM must decide its presence in the Asia Pacific market. This paper aims to compare the sales and growth of General Motors in different geographical areas and recommend a plan to optimize the growth process. It is important to compare the sales and revenue growth of the regions and understand the growth potential of the regions. This will provide a clear picture as to the decisions that GM’s management must take in order to tap a growing market rather than expand a market, which is declining.
Research Plan
The paper will do an external analysis of the GM in North America, Europe, and Asia in order to understand what opportunities or threats the regions hold for the company. Then we will do an internal analysis of the sales and financial data of the company to gauge the internal strength of the company in these regions. The company financial data is compared between regions in order to understand the effective growth and the benefits of it that the company experiences and which have greater growth potential in the future.
Data Analysis
The data studied is for four regions of GM’s operations viz. North America (GMNA), Europe (GME), Asia Pacific (GMAP), and Latin America (GMLAAM). The data analysis part is divided into two parts – (1) External Analysis and (2) Internal Analysis. External Analysis compares the social and economic factors affecting the regions under study in order to ascertain the opportunities and threats that entail the region. External analysis will also compare the industry growth in the above regions. The internal analysis will compare the sales and financial records of GHM in these regions.
External Analysis
Threats
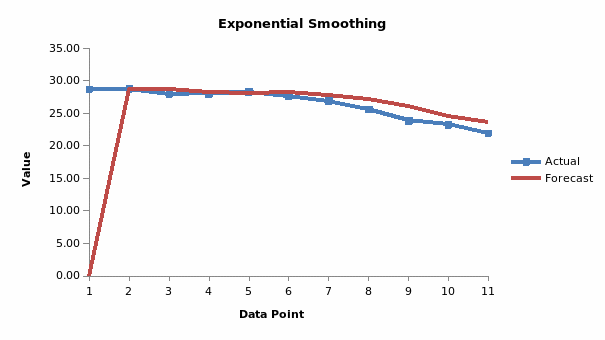
An external analysis of the automobile share of GM in the US market shows that the market share of GM in the auto market has been declining continuously (Ward’s Auto 2009). An analysis of the market share of GM in the US shows that the market share has declined, and can be expected to decline in future. This is derived from the calculation of the moving average of the market share of GM in the US since 1998 through 2008 (see figure 1).
Further, it has been observed that even with declining gasoline prices in the US, the market share of GM has been declining. This has been observed through a correlation analysis of the US gasoline prices since 1990 and market share of GM in the US during the period. However, the market share of Toyota has been positively correlated with the gasoline prices. Further, a correlation analysis of the market share of Toyota and GM shows that they are negatively related indicating that with increasing market share of Toyota, GM’s market share in US has declined. This implies that GM has lost market share to competitors like Toyota.
Table 1: Correlation between Gasoline price and GM and toyota’s market Share in US
Given this correlation, one question that arises is that the effect of increase in gasoline price on the overall automobile market in US. Did the automobile market shrink with increase in gasoline prices, as by reasoning of microeconomics, automobiles and fuel are complementary products? A correlation analysis of the US automobile market and GM’s market share with the macroeconomic indicators of the US economy like gross domestic product at constant prices (GDP), per capita income, unemployment rate, employment, and population.
The correlation analysis shows that GDP has a negative correlation with US automobile market indicating that when GDP was low, the market for automobiles was high and vice versa. Therefore, from the US example it can be stated that with an increase in the per capita income in US there has been a decline in the automobile sales in the US. With increase in per capita income in US, the share of GM in the automobile market of the US also declined. Further with increasing employment GM’s market share declined. This indicates that even though more people are employed in the US market and they have higher per capita income, there is a lesser demand for cars made by GM. However, the US auto market itself shrunk with increasing employment.
Table 2: Correlation Analysis.
From the above analysis it can be conclusively stated that with increasing per capita income in the US and higher employment there has been a shrinking of the automobile market as well as the market share of GM in US. Intuitively it can be concluded that the brand preference of the US customers was shifting and the US automobile market was mature and saturated with little scope for market expansion. Therefore, it is pertinent for GM to look for newer regions where it can expand its operations. Therefore, the next analysis section will try to look for opportunities in emerging economies and find out reasons as to why GM should expand further in tm. For convenience, we give particular attention to Asia-pacific and more importantly the BRIC nations and compare it to the US.
Table 3 shows that the correlation between the market shares of GM and that of its competitors has mostly a negative relation. It is only with the American automobile manufacturers that GM has a positive relation. This indicates that the American customers have changed their preference from American made vehicles to foreign makers like Japanese and German carmakers. Therefore, the US market share of GM and carmakers like Toyota, Honda and BMW has a negative correlation.
Table 3: Correlation between GM’s market share and that of its competitors
Opportunities
Figure 2 plots the GDP of the BRIC nations and the US. It shows that the GDP of US is much higher than the rest of the countries. However, the background study has suggested that the automobile market is best emerging in these countries. So why are these markets a better place for automobile manufacturers than the US market? The reason can be found in the growth rates of these countries.
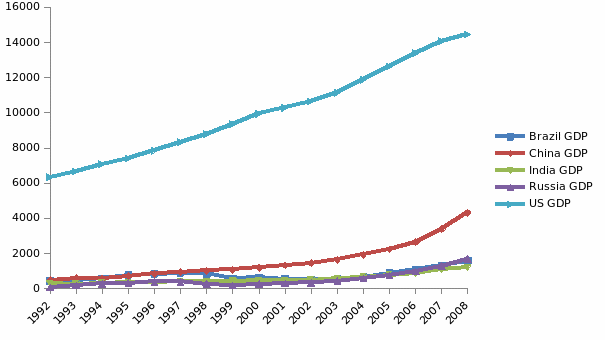
The GDP growth rates of the BRIC nations are high (IMF 2009). A descriptive statistical analysis of the GDP growth rates of BRIC nations and the US shows that the mean growth rate of US is merely 5.3 while that of China is 15, Russia 24.4, India 9.8 and Brazil 9.9. Therefore, the carmakers have a better chance of expecting a growth in market in these regions as the markets are not yet mature and it is still growing.
However, the standard deviation of the GDP growth rates shows that they are volatile for Russia, which has a standard deviation of 32.6, and Brazil at a standard deviation of 17.1. The US has the most stable GDP growth indicating a mature economy. Therefore, the best markets for GM to target are that of India and China, which are growing fast and has relatively lower standard deviation of the GDP growth rate.
Table 4: Descriptive statistics of BRic nations and US.
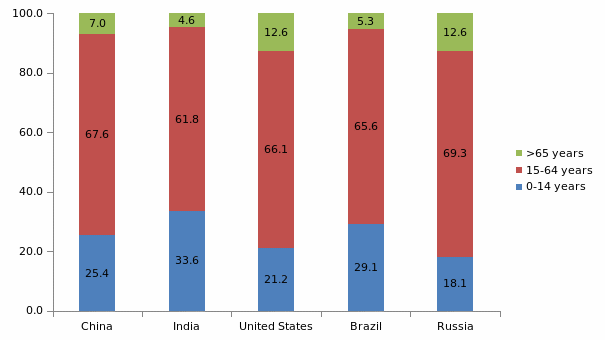
Further, on analyzing the age structure of the population in US and the BRIC countries we see that the average age structure shows that China has maximum population in the age group of 15-64 years, which is the working age group. India too has a large young population and the largest percentage of population below 15 years of age. This indicates a potentially a large future market.
Therefore, the external analysis demonstrates that GM’s market in the US is shrinking due to the overall shrinkage in the automobile market in the country. This may be due to the maturity that the market has attained. Further, there is a negative correlation between GDP, per capita income and employment of US with the US automobile sales and the market share of GM. The former indicates maturity of the automobile market where it has almost reached a saturation point. The latter indicates that there is a shift in the preference of the market towards other manufacturers and GM’s market share was going to its competitors.
This is confirmed with declining market share of GM and increasing market share of other automakers like Toyota and Honda. Another interesting phenomenon that is observed in case of US market is that the increasing preference for foreign made cars and declining demand for American car brands. Further, the external analysis shows that the BRIC economy is growing very fast with the countries having the highest mean of GDP growth rate. Therefore, GM should concentrate on opportunities that the BRIC nations have. The external analysis gives the following result:
- The opportunities identified from the external analysis are the fast growing BRIC nation, which includes the fasted growing Asian economies like China and India in Asia-Pacific.
- The threats that are identified through the analysis are that from foreign cars in US and the shrinking automobile market in the US.
Internal Analysis
The internal analysis of the company will entail the sales figure comparison of the four regions where GM operates. Table 5 shows that the sales comparison of the regions where GM operates i.e. North America (GMNA), Europe (GME), Asia-Pacific (GMAP), and Latin America (GMLAAM). The data for the sales has been derived from the Annual Report of the Company for 2008 and they are for the years 2006 through 2008 (GM 2008). The table shows that the GMAP and GMNA has a negative correlation of sales figures indicating that when there is a rise in sales in GMAP, there is a fall in the sales in GMNA. From the original sales figures, it can be observed that with every year the sale of automobiles in GMAP were increasing GMNA was declining (see Appendix A).
Table 5: Correlatation Analysis.
Figure 4 show that the industry volumes in the regions are increasing for only two regions i.e. GMAP and GMLAAM while that in GMNA and GME are declining, indicating that the markets in the regions are in a declining phase.
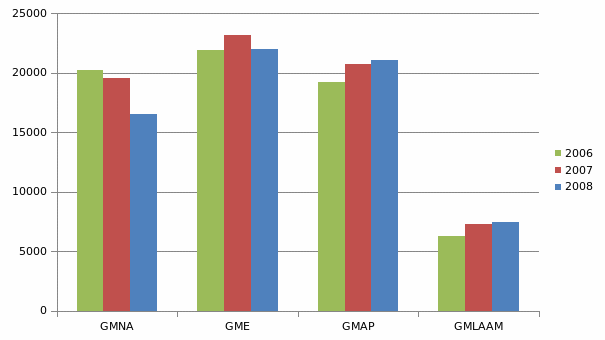
Therefore, the markets are declining for automobiles in North America and North America and Europe. Consequently, the market share of GM in these regions has been declining in the following regions i.e. GMNA and GME has been declining and that in GMAP has been increasing.
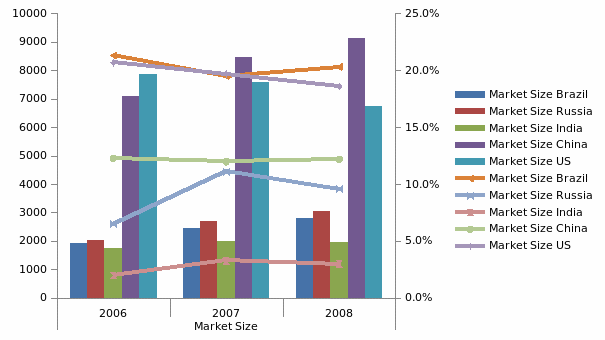
Figure 5 shows that the industry in the BRIC countries is increasing while that in the US, which is the largest market for GM, is declining. Further, the market share enjoyed by GM in the US is declining with the shrinking market size. Thus, this is expected to affect the profit of the company negatively. While that in the BRIC nations are increasing with increasing market share.
Table 6 provides a correlation analysis of the market share to the market size. This will show the amount of the market that can be tapped and if the company has been capitalize on the available market properly. The analysis shows that the correlation between the market share of GM in Brazil and the market size of Brazil is negative indicating that the market share has increased with the decrease in market size and vice versa.
This shows that GM has not been able to capture the market when it is growing, indicating that with the growth of the market size GM’s competence in the market has declined. Similar result has been observed in China where with increasing market size, GM’s market share has not increased giving a negative correlation between the two. In other countries, the correlation results are positive indicating that the management decision to increase or decrease market share has varied with declining or increasing market size.
Table 6: Correlation analyis btween market size and market share in BRIC nations and the US.
From the internal analysis, it is clear that with the shrinking of the North American market there has been a decline in the market share of GM, which has adversely affected the profit of the company. This is primarily due to the over emphasis of the company on the US market. However, with the increase in the market size of the BRIC regions and especially that of the Asia-Pacific and Latin America, GM must concentrate on emphasizing sales on these markets.
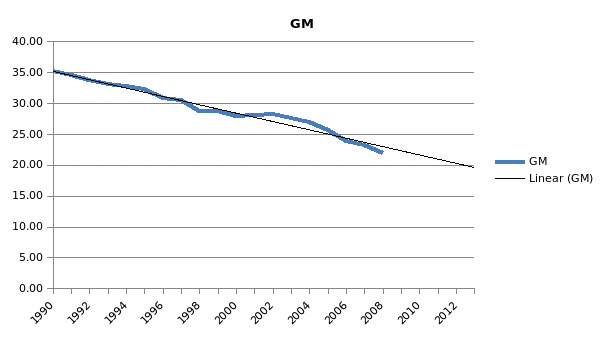
Further the linear trend line for GM’s market share in the US for the next 5 years is expected to fall further (see figure 6). This is indicates that the market for GM in the US is declining and is expected to fall further in the future.
Therefore, the internal analysis identifies the following:
- GM has an increasing market presence in Asia-pacific especially in the BRIC nations, which is strength of the company.
- Weakness of the company is declining US market.
Conclusion
The statistical analysis of the internal and external data of GM shows that the company should leverage the opportunities available from the emerging nations especially the BRIC countries. The main reasons that are evident from the research are
- The threats of declining and saturating US market and declining demand for US automakers in the US and increased competition is a threat to the company’s US operations and a definitive hindrance to further US expansion.
- The recession has declined the demand for automobiles in the US and European market which has led to a drop in sales. This is a threat to the automobile companies primarily concentrating on these two markets.
- The US automobile market is mature, not likely to grow further in future, whereas the market in the BRIC countries and Asia-pacific is nascent, and provides the opportunity to the company to capture an unexploited market.
- BRIC and Asia-pacific region has a young population with increasing earning power whereas, US has an aging population. This makes the former a more attractive market due to the higher population growth with spending power.
- Further internal analysis also shows that the sales in the Asia-Pacific region has been growing very fast especially in the BRIC nations.
- The internal analysis also shows that GM has experienced more growth in sales in the Asia-pacific region than from US or Europe.
The above-mentioned reasons are a clear indication of a shift in the market towards the Asia-Pacific market. The macro as well as micro factors indicate towards a more efficient and growing market in the region and therefore, a multinational company like GM must try to leverage the advantages of a growing economy and market.
Appendix A
Source: GM Annual Report 2008.
References
Crain, K 2009, ‘Was history telling us the truth?’. Automotive News, p. 12.
GM 2008, General Motors Annual Report. Web.
IMF 2009, World Economic Outlook Database. Web.
Thompson, C 2009, ‘GM global sales slip 15.4% in 2nd quarter’, Automotive News, p. 24.
Ward’s Auto 2009, U.S. Vehicle Sales Market Share by Company, 1961-2008.
Welch, D 2009, GM Gains, But Weaknesses Remain. Web.
