Background information
Merging the history of the company
The merging history of Dubai World had been started by the acquirement of one of its major portfolios recognized as DP World. Through such acquisition, the company had been enabled to gain growth in the mid- 2000s. Finally, the venture had been established from the merging agreement of Dubai Ports Authority and Dubai Ports International during the year 2005, September (Advameg 1-3). Consequently, this company, in terms of Dubai World can be remembered due to several significant merging issues, such as-
- CSX World Terminals in 2004.
- Combination of DPA and DPI as a single entity of DP World in 2005.
- Operations of P and O’s port terminals in 2006.
After that, the basic venture Dubai World has long-established the merging condition of Istithmar World Real Estate with Nakheel. This group is generally handled by the Royal family of Dubai, which is bearing the liability of such contact by formulating it as one of the world’s biggest property entities. This contact also generates a promise to develop an extensive real estate organization developed in terms of managing assets through funding and investment (Property Week 1- 2). Finally, Dubai World had gained 31.5% of Emaar’s shares, which is the largest construction entity in the nation (Wadi 1).
Establishment of the company
according to the annual report 2007, the selected UAE investment company known as Dubai World was founded by an order ratified in 2006, by the Prime Minister and Vice President of this country and the ruler of Dubai named Rashid Al Maktoum who is also the person holding most of the shares of this company. Being stabilized in diversified investment, its headquarters are situated in Dubai, United Arab Emirates. Produced products include investment products with a revue status, operating income, and net income recorded for the year 2008 of $18 billion, $1.4 billion, and $1.17 billion consequently (Hoover’s Inc 1).
The company is well-known for its major tasks of managing and supervising multiple business portfolios for the local government through multiple business criteria. These are promoting the province as a center of the commercial transaction along with the image of international investors of the economy. On 2nd July 2006, the company had introduced itself as a holding organization with up to 50000 personnel working in more than 100 cities of the world.
Today, the group possesses widespread real estate funding in the U.S.A, South Africa, and the UK and also facing a major threat from the EU’s step of laying out a bundle of simplicity, accountability, and certainty of funds. Its general strategic development criteria involve dry docks and maritime, transport and logistics, investment, and finance along with urban development (Dubai World 1).
Along with another holding, it incorporates the ownership of international marine terminal machinist DP world, real estate owner Nakheel as well as 20% ownership of Cirque du Solei. During the last year, the group has become unable to sustain its debt repayment schemes accounted for merely $24.9 billion (Hoover’s Inc 1).
The vision of streaming on its core responsibilities by the group motivates it to move at a faster speed. Finally, the company has established in terms of long-run investment along with the value generation process for the Dubai Government (Dubai World 1).
Key investment portfolio
Dubai World Company consists of several investment portfolios. Among those, the most significant portfolios have discussed below-
- DP World: DP World was being identified as the 2nd mega port terminal operator that dealt with over 40 million TEUs in earlier 2006. At that time, it had been coerced for selling U.S ports although it had a minor impact on the overall glory of the company’s success. Nowadays, this subsidiary of Dubai World Company is well-repudiated as the highly expanded port operator. Regarding this issue, the company has enlarged itself through sophisticated strategic moves with a target of 70 million TEUs in 2010 (DP World 1-5).
- Drydocks World: This portfolio of Dubai World has situated at one of the busiest trading ways of the world in the Middle East, which is admired as the flagship entity of its major holding group. It is a ship repair yard, also engaged in some other tasks incorporating conversion of vessels as well as the construction of the innovative building and offshore. It addresses 4 prominent shipyards in Asia for ship and rig development, conversions, and repair backed by skilled engineering and designing (Drydocks World 1). Furthermore, the company’s operation is expanded in various regions of the world, such as-
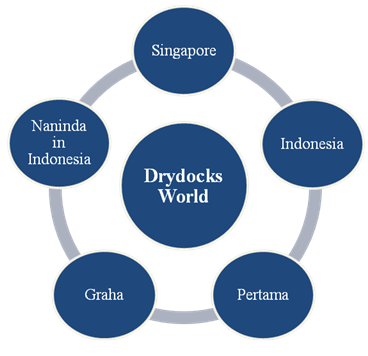
- Economic Zones World (EZW): It is an international builder and operator of economic areas, logistics, technological issues, and manufacturing parks handled by its mother concern- Dubai World. It generates an extensive arena of infrastructure bases to the home country and foreign ones with huge customer support (EZW 1-2). Its major portfolios involve-
- Jafza: Greatest open zone;
- Gazeley: Supplier of carbon activist logistics space;
- TechnoPark: Research-oriented industrial park;
- Dubai Auto Zone: Industry-wise open zone;
- Istithmar World: This is another major investment entity with several international portfolios in Europe, North America, Asia, Africa, and the Middle East. The diversified verticals include final customers, industrial and monetary responsibilities to hotels, and business assets (Istithmar World 1). Some investment portfolios of the company are-
- Consumer: This section incorporates healthcare services, specifically, final comfort retailers, amusement, and wellness facilities (Istithmar World 1-10). Such as-
- Barneys New York, ESPA International, Loehmann’s, EMPG International Ltd, Bumrungrad International, Cirque du Soleil, etc.
- Industrial: It considers visibility of profit, asset- beam activities, valid corporate structures, more profit with less price concern, etc., for example-
- Spice Jet
- Hans Energy
- Dubai Aerospace Enterprise and Inchcape Shipping Services etc
- Financial activities: Its investment sectors include banks, corporate management of assets, pension, real estate, hedging, and insurance. As-
- Insure Direct, Tamweel, Arcapita, BMI Bank, GLG GP, etc.
- Hotels: The global investments range from the U.S.A to Africa to the Middle East (Istithmar World 1-10). Some renowned hotels and resorts are-
- Atlantis, the Palm, Mandarin Oriental NY, Kemplinski Djibouti Palace, Kerzner, Fontainbleau Miami, IHI etc.
- Commercial building: It contains legacy buildings situated in Southeast Asia, the Far East, Africa, and Europe as-
- South Beach Consortium, 450 Lexington Avenue, Grand Building, Intext Shanghai, etc
- Consumer: This section incorporates healthcare services, specifically, final comfort retailers, amusement, and wellness facilities (Istithmar World 1-10). Such as-
- Limitless: It is a global entity of modern engineering and life-enhancing maturities of Dubai World;
- Nakheel: It also poses a variety of projects like- Palm Trilogy. Here, the world and waterfront will insert moreover 600 miles beachfront to the coastal area by casing 2 billion square feet.
Economic aspects of Dubai World Company
Inflation, number of unemployment, GDP before the global crisis of UAE
The fact of global recession has a major socio-economic impact on most of the countries of the world. Like other nations, the economic and financial condition of Dubai shows variation in total output compared with the previous and afterward timeline of recession by considering the prime indicators of the national economy. However, as we know that the over some previous years, the UAE economy has shown better performance than many other countries because of the high price of oil along with growth in the non-hydrocarbon arena before the recession (Global Investment House 1). Some other major issues during that period have been explained as below-
Immediately before the period of global crisis, the GDP growth of the country was extremely high as in 2005 and 2006, the country recorded nominal GDP of $139.8 billion and $170.2 billion consequently (Global Investment House 1). In 2007, it had reached $198.8 billion Some relevant data targeting GDP are shown below-
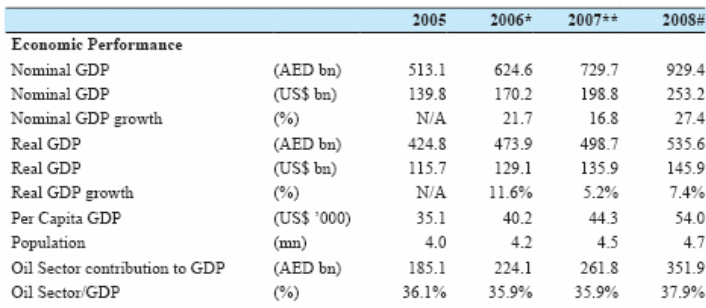
According to table 1, in 2008, real GDP growth reached 7.4% which is pointed by primary approximation for accomplishing real GDP of AED 535.6bn within the same year. Here, this figure can be evaluated in terms of GDP growth rate in 2006 and 2007 of 11.6% and 5.2% consequently. This strong monetary presentation in 2008 was possessed to the higher value of oil pertaining most of the time of the year and such advance given by the non-hydrocarbon division. Similarly, the nominal GDP, nominal GDP growth, and per capita GDP secured the highest score in 2008 (Global Investment House 4).
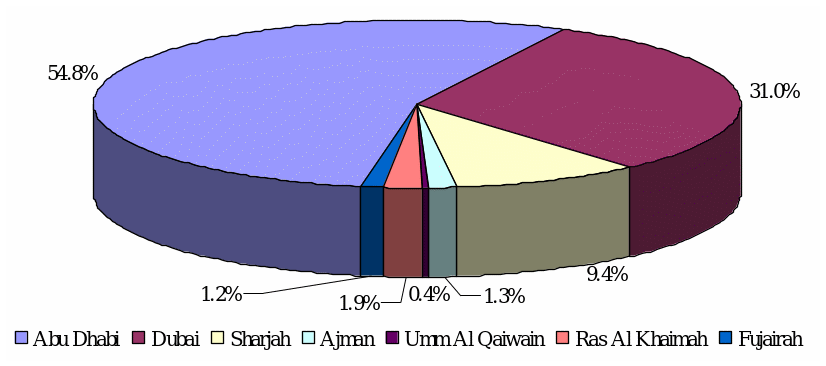
In 2006, Dubai gave 31% value to UAEs total GDP while this rate had been enhanced in 2007 by 17.3% (Global Investment House 2). The situation can be shown as-
In 2006 and 2007, in terms of the balance of payments, the country had accounted for $56.6 billion and 47.0 billion of trade balance while the overall balances (as a percentage of GDP) were $4.1 billion and $24.0 billion respectively (IMF 33).
Inflation, number of unemployment, GDP during the global crisis of UAE
Because of the depression, the Dubai market scenario had been in several criteria. Such as-
- In 2008, DFM produced $164.7 million of net income, which shows that the introduction of a recession could not affect Dubai’s targeted profit. However, revenues were dropped from $307.6 billion to $247.9 million in 2007. The province had also experienced a 12% of inflation rate in 2008 while in 2009 the rate was 11% with lower import values (IMF 8- 20).
- During the recession, the real estate industry of Dubai had been affected seriously with a drop between 50%- 60%, which created a challenge for rescheduling of debts although the overall candle of business in that province regarding trade, finance, and tourism was not abolished completely (Real Estate Development, ET AL 1). At the end of 2009, Nakheel owned a $4 billion redemptions of the bond. The equity market of Dubai at depression is shown below-
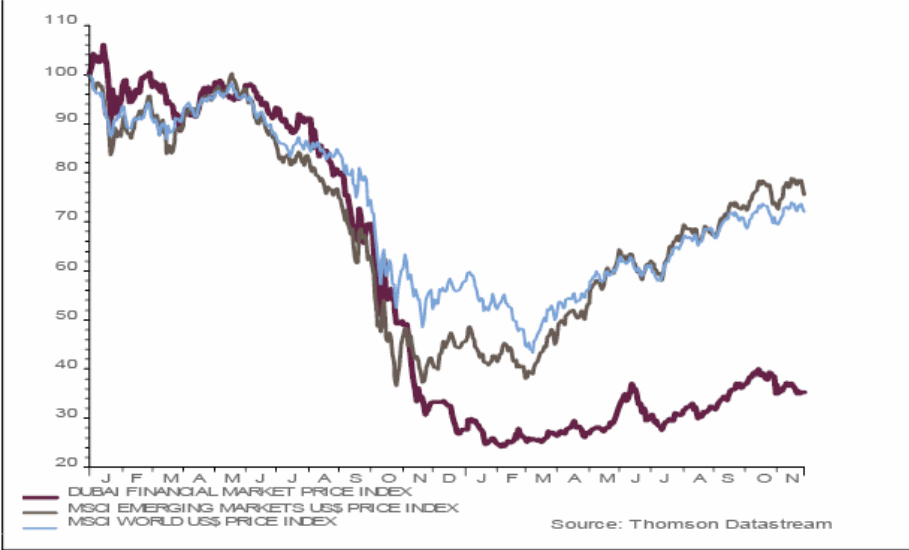
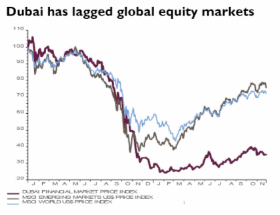
The above graph is showing that over time, the value of DFM was falling than the emerging markets along with the global market. Among these three markets, Dubai was in the most vulnerable position while the world’s US$ price index scored the top. Dubai Intermittently, sensitive goods were also being traded with a cut down of gold price. It reflects that the G7 bonds were the prime gainers through yields declining by 20 bps. There are 4 basic factors of such drop regarding the shock to depositors, market as trapped- off safeguard during the national holidays, limited assurance of the investors with the extent of their intention of taking it as a scope (Astorri, Jean-Maurice and Henry 1).
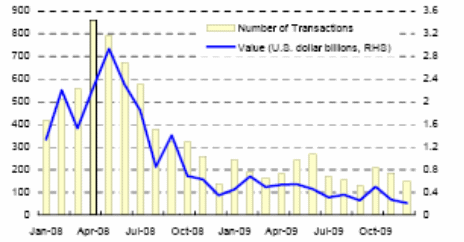
The above graph is showing the comparative scenario between the years 2008 (From January to October) and 2009 (From January to October) in terms of property transactions in Dubai. The volume of real estate sales of the country had increased smoothly in January 2008 and reached the top in April. After gaining such growth, the market had experienced a continuous fall from July 2008 to October 2009. Within that period, the value of the transactions had been fall up to US$0.4 billion (IMF 12).
- Massive job cuts had occurred in the tourism and hospitality industry of Dubai along with the real estate sector. Dubai World had to downsize 10500 workers globally. The same is true for some other organizations including Emaar, Damac, Nakheel, Tatweer, and others (Heyer 1- 2);
- The satiated of Dubai’s real estate gurgle in 2008 and the post- Lehman blackout of resources markets enhanced investors’ anxiety about Dubai’s debt repayment capability. After July 2009, the government had established DSF for restructuring the company with $20 billion packages (IMF 40- 50), such as-
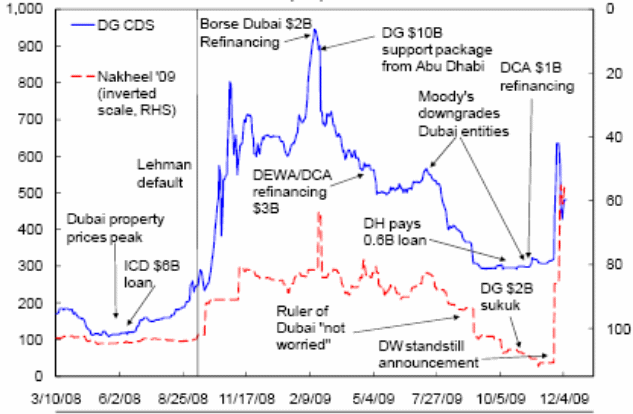
This graph summarizes the debt situation of the Dubai Government and Nakheel at several months of 2008 and 2009 with significant events while the blue line is showing DG CDS and red shows Nakheel 2009 Sukuk. In June 2008, Dubai property scored the top value. In February 2009, part of the $2b loans was refinanced where Sukuk trade at 60¢; In March, DG sold a $10b bond to U.A.E central bank. Finally, in September there was a declaration by DW for rescheduling $12b liability regarding Nakheel followed by Nakheel’s foreign asset transformation to Istithmar World (IMF 44).
Economic investment blocks for the company
CNN (1) reported that Dubai World is the most significant economic channel for the UAE government to enter into the diversified global investment markets through three prime modes namely,
- investment;
- leisure or tourism packages,
- investment in property.
It has well known that Dubai is the most densely inhabited place among the GCC members and after the approval of a decree by the former Monarch, Dubai World has started its journey in March 2006 where the ruler of Dubai Sheikh Mohammed bin Rashid Al Maktoum has owned chief piece of the Company’s share. Since their domestic and international operation, Dubai World has primarily operated four Economic Investments Blocks and they are referred to as:
- transportation and logistics;
- drydocks and martime;
- urban development projects (UPD);
- investment and multi-product financial services.
In describing investment blocks of the company, it should to apparent that the DP World is an indispensable part of Dubai World’s asset value where the DP world has operated the largest MTOs. Alternatively, Dubai World’s diversified investment strategies and working with the Drydocks World as well as the Dubai Maritime City has successfully established Dubai as another global significant maritime hub and in addition, another chief shipbuilding industrial location. On the other hand, the Istithmar World is famous for the investment arm of the Dubai World mostly for international operations. Conversely, the Nakheel is the strongest source of the Dubai World to execution of urban and property development projects including global projects.
Inflation, number of unemployment, GDP before the global crisis of UAE
Immediately after the inflationary pressure at the end of 2009, the UAE government assures the mass people and investors of Dubai World about the debt calamity while the company announced the renegotiation of $26 billion in responsibility by Nakheel. After a few days, the government got $10 billion of assistance from Abu Dhabi among which $4.1 billion was to be used for repaying Nakheel’s debt. (International Monetary Fund 8-15). In January 2010, it had property assets of more than $120 billion by exceeding the debt of $57 billion. Then, it decided upon restructuring through conversion of $8.9 billion of government liability into equity. (Dubai World Debt Situation, ET AL 1- 2). Some other features are-
- On 4th January 2010, the GREs (Dubai Government-Related Entities) reduced to junk standing by including DP World and Emaar Properties PJSC along with some other Dubai corporations. In this case, S and P also deduced the ratings on 4 banks of Dubai to junk class for their huge disclosure to local organizations involving DW and Nakheel as a troubled sister concern;
- Because of a reduction in the stock market index in Dubai, the rest of GCC felt a higher vulnerability. Though CDs spreads have diminished as the repayment of Nakheel Sukuk, they got assessed for Dubai issuers (IMF 13) and this can be shown as-
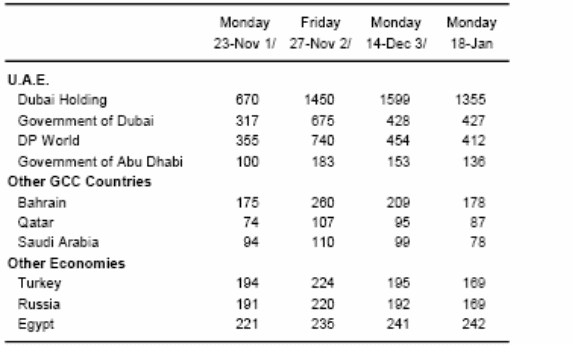
In December, the value of the Nakheel bond dropped to 50¢ as compared with 111 on 23rd November. CDS increased on GD’s highest boost while GREs of Dubai dropped by various slashes. Meanwhile, Dubai and Abu Dhabi stock markets experienced a sharp fall while the other GCC realized more instability, as well as other nations’ CDS, spreads enlarged slightly in the week followed by declaration. Though such spreads have diminished during the Nakheel Sukuk repayment period, they continued to be eminent for the issuers of Dubai (IMF 13).
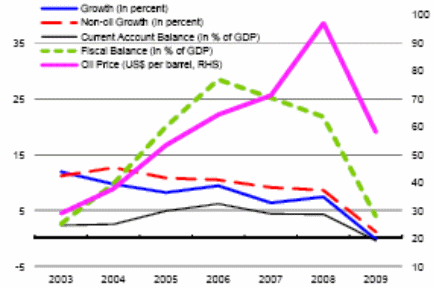
- The macroeconomic impact of worldwide financial crises on Dubai has been shown below by some figures-
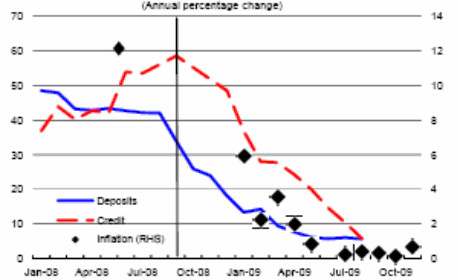
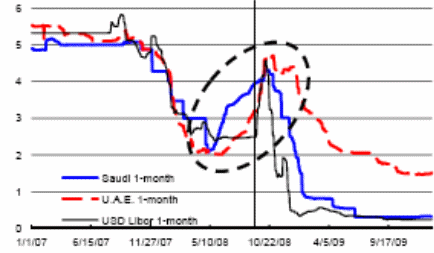
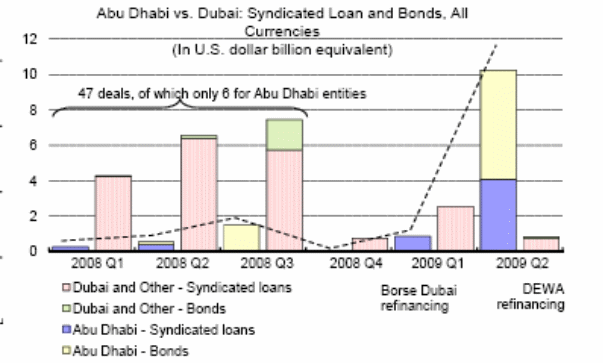
From the following graph, it can be interpreted that in the first quarter of 2008, Dubai scored higher on syndicated loans than Abu Dhabi while this trend continued up to the third quarter of the same year. Dubai and other bonds were on the top of Dubai loans in the second and third quarters with the sole presence of Abu Dhabi bonds in the third quarter. In the fourth quarter, Dubai scored lower loans, the first quarter of 2009 shows lower loans of Abu Dhabi than Dubai while the second quarter reveals increased bonds of Abu Dhabi over its loans (IMF 11).
- The province permitted that 2010 budget with a shortage of 2% of GDP although it was designed to keep a balance between economic and social objectives (Gowealthy 1)
- Despite active government strategies, the real estate market of Dubai still has some vulnerability because of the international economic downturn. The expected re-sale profit on new assets in Dubai was at a downward rate. It had affected the market as a profit cutter.
Regarding the oil prices of WEO, in 2010, Dubai achieved a 10% surplus of GDP. There, the fiscal policy had followed a sustainable way for exempting the negative influence of recession along with backing the diversification of the non-oil economy. The external current account of Dubai was also able to yield 7% of GDP in that year. Finally, recessionary evil would become visible if the restructuring plan of GW would create extra ambiguity by removing the projected financial risks on corporations, like- DW and others (International Monetary Fund 10).
Summary of the economic status of UAE before, during, and after the global recession
Figure: Summary of the economic status of UAE before, during, and after the global recession.
The economic effects of DW in the economy of UAE before, during, and after the crisis
The impact of the global recession on the economy of any country cannot be overlooked including UAE. It is the country that has had a high economic growth over several years because of high oil prices and non-hydrocarbon fields. Along with other significant economic indicators, Dubai Government’s mega venture Dubai World was also affected by the recession by leaving its major impact on the entire economy.
Before the recessionary pressure, UAE’s average inflation rate ranged between 2.90% to 6.27% while GDP output and the unemployment rates were 11.6% and 2.4% consequently. During the period of the financial crisis, the country recorded the lowest rate of inflation at 1.6% to the highest of 11.10%. GDP fall by 5.2% to 7.4%. The unemployment problem rose by 3.45%. At that time, DW also downsized about its 10500 employees worldwide. Then the company also received a significant amount of debt from the Dubai government. Finally, after the crisis which started from the ending part of 2009 to the beginning part of 2010, the country was not immediately able to change its financial crisis as the GDP growth rate was between -2.7% to 2.6%.
Inflation and unemployment rate were between 2% to 2.2% which shows that the overall crisis is getting to be improved although the rate of unemployment was at the highest level of 4%. Since the Dubai stock market index fell, the rest of the GCC countries faced greater vulnerability although Nakheel and Sukuk got assessments from Dubai investors. Thus, the recession caused a negative impact which would be apparent throughout the ambiguous restructuring plan of the government considering its major ventures including DW.
Finical aspects of Dubai World Company
Dubai financial market index before, during, and after the crisis
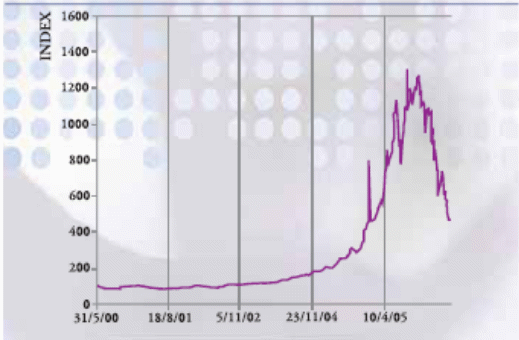
- Regarding inflation, from 2002- 2007, UAEs general inflation rate was 6.27% with a peak of 11.10% in 2007, December, and a least of 2.90% in 2002, December (Matly and Laura 5). According to DFM (Dubai Financial Market), immediately before the recession, the market index cut down to a low of 433 by yielding a compound monthly diminishing rate of 8%, as-
- In 2009, the local government had declared to finance all the investors of Dubai World and its ancillaries to a standstill. It also owned a debt of $59 billion comprising 3/4th of UAEs $80 billion of total debt. It incorporates a $3.5 billion loan beyond the capability of the company to repay within the deadline. This problem also led to the dropping of EU stock indexes by 3%. This condition reflected that the Dubai government was not mandatory by the lenders or could not pay any contractual assurances for the debt of Dubai World. In November 2009, the share value of the company fell by 7.3% and 8.3% in Dubai and Abu Dhabi.
- Dubai Chamber of Commerce feels that during the 1st 7 months of 2010, the average rate of inflation was 3% in Dubai that had been denoted as “short-lived” by indicating that the economic situation was getting optimistic. Additionally, general consumer prices and housing-linked consumer prices were in the upward trend. Dubai exchanges financial market index had enhanced by 6.8% in August 2010 than July 2010 (Gowealthy 1).
Financial leverage and liquidity ratios before the crisis
Financial Leverage
In particular, the financial leverage ratios are a mode to express the debt financing sources of a Company as well as a comparative tool to classify debt, total capital, and equity piece of a firm (Block and Geoffrey 101). Additionally, here it has to be quoted that financial leverage ratios are of two types; one is termed as a component-based leverage ratio, which defines proportional measures of asset, equity, and debt. The second one is coverage ratios that stated relationship status among asset, equity, and debt. Following are the financial leverage ratio calculation for the DP World during 2007 (Drake 9–11).
At the end of 31 December 2007, the following are the key leverage data for the DP World.
Total Debt = USD $2,843 million
Long–term Debt = USD $3.25 billion = USD $ (3.25 x 100) million = USD $325.00 million
Total asset = USD $17,190,207 = (17,190,207/1000) = USD $17190.207 million
Total Shareholders’ Equity = USD $1,105,049 = (1,105,049/1000)
= USD $ 1105.049 million
Earning before interest and taxes (EBIT) = USD $1,099,833 = (1,099,833/1000)
= USD $1099.833 million
Interest = USD $452,141 = (452,141/1000) = USD $452.141 million
Lease payment = USD $28,641 = (28,641/1000) = USD $28.641 million
Table 2: Ratio.
Liquidity Ratios
Financial leverage ratios are treated as comparable measures whereas the liquidity ratios are justified a Company’s competency to generate required cash obligations for short time financing. Following are the three chief liquidity ratio calculations for the DP World during 2007 (ABAHE 2).
At the end of 31 December 2007, the following are the key liquidity data for the DP World. (DP World 10, 17, 18)
Current Assets = USD $3,837,391
Current Liabilities = USD $8,817,432
Inventory = Revenue generated from last year’s operations = USD $2,731,440
Cash at hand = USD $3,058,863
Marketable securities = (3,245,300,000 shares x USD $0.10 per share)
= USD $324,530,000
Table 2: Ratio.
Financial leverage and liquidity ratios during the crisis
Financial Leverage Ratios
Following are the financial leverage ratio calculation for DP World during 2008.
At the end of 31 December 2008, following are the key leverage data for DP World.
Total Debt = USD $4,215 million
Long–term Debt = USD $4.05 billion = (4.05 x 1000) = USD $4050 million
Total asset = USD $15,498,852 = (15,498,852/1000) = USD $15498.852 million
Total Shareholders’ Equity = USD $482,214 = (482,214/1000)
= USD $482.214 million
Earning before interest and taxes (EBIT) = USD $1,339,842 = (1,339,842/1000)
= USD $ 1339.842 million
Interest = USD $ 290,960 = (290,960/1000) = USD $ 290.960 million
Lease payment = USD $25,549 = (25,549/1000) = USD $25.549 million
Table 3: Ratio.
Liquidity Ratios
Following are the three chief liquidity ratio calculations for the DP World during 2008.
At the end of 31 December 2008, the following are the key liquidity data for the DP World.
Current Assets = USD $2,012,939
Current Liabilities = USD $1,434,241
Inventory = Revenue generated from last year’s operations = USD $3,283,120
Cash at hand = USD $1,204,074
Marketable securities = (16,600,000,000 shares x USD $1.00 per share)
= USD $1,660,000
Table 4: Ratio.
Financial leverage and liquidity ratios after the crisis
Liquidity Ratios
Following are the three chief liquidity ratio calculations for the DP World during 2009.
At the end of 31 December 2009, the following are the key liquidity data for the DP World. (DP World 32, 34, 35)
Current Assets = USD $3,805,635
Current Liabilities = USD $1,484,248
Inventory = Revenue from last year’s operations = USD $2,929,229
Cash at hand = USD $2,910,066
Marketable securities = (16,600,000,000 shares x USD $0.10 per share)
= USD $1,660,000
Table 5: Ratio.
Change in Liquidity Ratios
Table 5: Change in Liquidity Ratios.
Leverage Ratios
Following are the financial leverage ratios for the DP World during 2009. (DP World)
Financial Leverage Ratios
Following are the financial leverage ratio calculation for the DP World during 2009.
At the end of 31 December 2009, following are the key leverage data for the DP World. (DP World 19, 32, 34, 41, 68, 108)
Total Debt = USD $5,059 million
Long–term Debt = USD $3.25 billion = (3.25 x 1000) = USD $3250 million
Total asset = USD $18,960,536 = (18,960,536 / 1000) = USD $18960.536 million
Total Shareholders’ Equity = USD $332,862 = (332,862 / 1000)
= USD $332.862 million
Earning before interest and taxes (EBIT) = USD $1,072,442 = (1,072,442 / 1000)
= USD $ 1072.442 million
Interest = USD $357,204 = (357,204 / 1000) = USD $ 357.204 million
Lease payment = USD $12,955 = (12,955 / 1000) = USD $12.955 million
Table: Ratio.
Change in Leverage Ratios
Table 5: Change in Leverage Ratios.
Net profit of the company
Hypothetically, the term net profit defines a given Company’s earning value for a given time frame where calculation of the net profit is performed as the difference between total revenues for the year and total expenses including general and administrative, interests, and lease payment (Block and Hirt 67–70). Calculation of Net Profit of the DP World at the end of 31 December 2009 is plotted in the following table and subsequently, calculation of Net Profit Margin is also executed (DP World 19-81)
DP World Limited. Net Profit Calculation At the end of 31 December 2009.
Table 5: Net Profit Calculation.
Calculation of Net Profit Margin
At the end of 31 December 2009, the following are the required data for calculating the Net Profit Margin of DP World Limited. (DP World 32, 81)
Net profit for the year = USD $146,695
Sales Revenue or Revenue Generated from Operations = USD $2,929,229
All Ratios in a Table
Profitability Ratios
In this part, profitability ratios from 2007 to 2009 have assessed DPW’s efficiency in generating return against their resources to recommend investors of DPW whether the investment would sound or not. There are four major profitability ratios namely
- gross profit margin,
- net profit margin,
- return on assets (ROA) and
- return on equity (ROE) as the following table.
Table: DPW Profitability Ratio at the end of 2007, 2008 & 2009.
Examination of Final Results of the Financial Ratios
Analyzing the results of the financial ratios before, during, and after the recession period has noticed a sign in the financial status of DPW in the area of leverage, liquidity, and profitability. Regarding this observation, the leverage ratios of DPW noticed a proportionate decline in capital structure because of the high debt burden. Equally, liquidity ratios have also revealed such a scenario where DPW was in a severe crisis of sufficient liquid assets to invest for recovery.
Alternatively, change in leverage and liquidity ratios in between during and after recession noticed several negative signs that were terrific news for the new investors as well as corporate bodies of DPW. At last, profitability analysis of required three phases has assessed that the gross profit margin of DPW was comparatively healthy in 2008 rather than 2007 and 2009. In conducting sound net profit margin, during 2007 was the favorable year than those two whereas ROA accomplished sound scores during the recession and poorest performance after the recession.
Finally, ROE respectively declined from 2007 to 2009. At the end of the analysis of the financial results, it has argued that frequent fluctuations of DPW’s financial attributes were greatly hampered their investment entrance and in addition, also disclose threats to explore the national economy of UAE.
Source of finance to the company
Principal Financing Sources
Dubai World date owned UAE Holdings Company is primarily financed through its stakeholders as well as crafting international assets like trade-offs with the HSBC bank. Several local financial analyses have argued that after the severe crash during the global recession, in 2009 Dubai World’s aggregate investment assets has been dropped from USD 157 billion to USD 120 billion compared with the previous fiscal year though would be able to repay their debts of USD 57 billion.
In addition, the impact of the recession on Dubai World’s financing sources has greatly affected and thus their strategic investment growth, as well as assets value in both domestic and international markets, cannot pass more than 20 %. In the meantime, Dubai Holding another state-owned segment of the UAE has occupied financing about UAD $100 million by DHCOG for the next five years on diversified business operations. Despite the harsh crisis during the global recession, good news for Dubai World is that the Adu Dhabi neighbor of Dubai now contributing significant investment aid to recover their emergency.
Alternatively, financing through foreign assets Dubai World has composed of DICDG and DHCOG that included other bank stakes globally. On the other hand, Dubai Holding has got a loan of USD 1.14 billion which would be matured within August 2011, and in addition, another significant issue is that the capital loan of Dubai International has already matured by June 2010. Being a shareholder of the London Stock Exchange, Dubai World has recently intended to craft more than USD 2.50 billion syndicated loan to flourish and smoother their next three years projects as well as associated spending though most of the time Dubai World Limited has eagerly tried to occupy through self-financing (Reuters 1).
Proposed Joint Ventures
A legal advisor of Dubai World has recently recommended another sister concern of the group to agree on financing about USD 2.0 billion on behalf of City Center Holdings, LLC in terms of joint venture where potential partnership share will be equal for all partners (Crouse 1).
Recession Restructuring Program
Last week of November 2009, the former governor of the UAE was announced through a press release that they already had undertaken several restructuring financing initiatives by composing two crisis handling entities namely, SFC and DFSF to smoother Dubai World’s operation and request the entire creditors to cooperate refinancing (DWSC 2).
Refinancing plans initiated by the company
Dubai World Debt profile
During the global recession share market fall of Dubai World make their debt moratorium and therefore, the international market exhibit a mixed reaction that reflected the actual nature of the crisis. On the other hand, entire associates, as well as market researchers of the Company, were greatly shocked that the current profile of the firm is soaring debt career and additionally, with the aid of government and constitution continuously stopped debt repayments to protect their sister concerns bankruptcy. Alternatively, another shocking event is that the UAE government was ignored the liability of the company’s shareholders equity.
Consequently, the financial authorities of UAE were anxious to see a systematic crisis as of the Lehman. Despite, the economic atmosphere of the company was then almost similar to recent global examples but government’s emergency recovering involvements replace those potentialities with the typical atmosphere of the debt market, and additionally, lenders were also worried about sharing crisis for a long. Conversely, whilst the global economy was greeting recovered, UAE government and their central bank back forward since of high credit risk repayment through money and before unlocking suspense of Dubai World debt share price of the firm dramatically dropped down (Astorri, Jean-Maurice and Henry 1, 2).
Following graph no 7 has conveyed that with the gradual shock of the global recession how harshly DP World has been affected through equity loss and conversely high debt liability. Before commencing of recession DP World ranked in the most precious position and expert of holding a stable gold price level. As a consequence of the recession required rate of the entity has declined dramatically, dampening investors’ interest, and finally, the scope of market expansion was constricted significantly. Alternatively, the stock mart of the entity has also turmoil proportionately for a long. (Astorri, Jean-Maurice and Henry 1, 2)
Modes to Refinancing
At the end of November 2009, the central bank of UAE proposed providing spare liquidity to refinancing debt affected Dubai World. As a result, foreign banks in the UAE were getting ready to generate the required liquidity for refinancing Dubai World. The assist of more liquidity was possible because of the superior service quality of UAE banks as well as their sufficient liquidity and finance funds through fellow citizen Abu Dhabi of UAD $10.0 billion. On the other hand, Port Operator another blockbuster of NASDAQ Dubai announced to join with the recovering program of Dubai World by issuing Sukuk of UAD 1.50 billion where profit rate is 6.25 % to pay UAD $46.90 million within a 180 days profit circle which has continued until 2017 (BBC 1).
Recovery measures are undertaken by the company
After a severe financial crisis during global economic rescission, Dubai World as well as their sister conglomerates have taken several emergency schemes like DFSF to get relief from the crisis. Subsequently, during the last week of November 2009, the government of the UAE was arranged a public conference to announce a proposal for Dubai World’s restructuring program to keep safe the Company’s domestic and global assets.
Additionally, the government proposal has recommended a request to entire creditors of the company to give time until the end of May 2010 for their all payable. According to the proposal, in the second week of 2009, the government announced that fellow citizens Abu Dhabi was recently funded around the US $10 billion, and thus, Nakheel another sister concern of Dubai World would be able to repay their debts as soon as possible.
Here it has to be quoted that meanwhile government of Dubai was issued a new law known as “Decree No.57 of 2009” for the recovering Dubai World as well as for future commercial crisis of their commercial companies in the both domestic and international market. The key purpose of issuing the Decree is to generate financial resources for debt recovery and the Decree is expert to defeat current Insolvency Laws in UAE inconsistent with the DIFC as well as required special Tribunal establishment through five members’ bench. In the light of the new Decree, the recovering attributes of Dubai World included –
- Tribunal establishment to commence recovering module,
- Applicant should keep in mind that there will be no option of appeal and tribunal decision will be considered as a result,
- For debt recovery, Dubai World and its conglomerates have kept the right to apply without noticing their entire creditors who are officially known as the Moratorium,
- The newly issued Tribunal has authoritative power to allow Dubai World and its sister concerns to acquire any future debts where current debts should rank ahead of the new debts counting secured debt,
- Despite debts, the Tribunal an extensive power to execution all properties crafted by Dubai World,
- in case of winding up of any sister concern of Dubai World should require to follow circumstances of a public limited company,
- Creditors who like to vote for restructuring the Company, they will be allowed if they hold 66 percent or two-third, and conversely, the opposite viewers have not yet any prospect for voting right under recovering (Rainey and Sara 2).
Mode of payment of its debts
According to the company profile of Dubai World, it has already introduced that it is a government holding company; moreover, the second-largest economic pillar of the UAE. As a consequence of this, it has assertively affirmed that since of government’s direct involvement as well as the harsh impact on UAE economy debt load of Dubai World would be also a cause of political damage therefore, the crash of the Company would be sensibly lost the prestigious status of the former government.
On the other hand, for the UAE government, Dubai World Group has been treated as a jewel since the proficient performance of the Company’s conglomerates like DP World. As a result, the UAE government as well as their experienced trade and business analyst would not suggest winding up the entity because of debt load and global economic downfall and the following are their probable mode of debt repayments (AAWSAT 1).
- Sale of Strategic Assets: Until late 2008, before the impact of the recession on Dubai World, the stock market profile of the Company is satisfactory. First of all, within October 2010, Dubai World authorities announced the sale of their most significant strategic assets to collecting fund of UAD $19.40 billion.
- Maximize International Asset Value: On the other hand, Istithmar Private Equity Holder of the Company is the owner of major international strategic assets, which recently announced and hope that that within next five years they would maximize their asset value by UAD $4.50 billion and hence debt repayment will be more flexible.
- Investment in Real Estate Development and funds from Abu Dhabi: October 2007, Dubai World invest in MGM Las Vegas approximately UAD $2.20 billion along with 5.90 % Stake equity and in addition, Las Vegas was got about UAD $4.80 billion only for their urban development. Conversely, last week of August 2010, MGM’s average share price after the investment was USD 9.40 whereas in 2007 average per-share price of the firm was USD 83.15. As a result, in terms of an investment portfolio, Dubai World was failed to collect debt funds and meanwhile, Abu Dhabi announced to donate USD 10.0 billion to recover the struggle of their neighbor.
- Insurance Policy for Risk-free Restructuring: to hold the current creditors as well as to prove their enthusiasm Dubai World offered an insurance policy to effective their debt repayments by selling their core strategic assets.
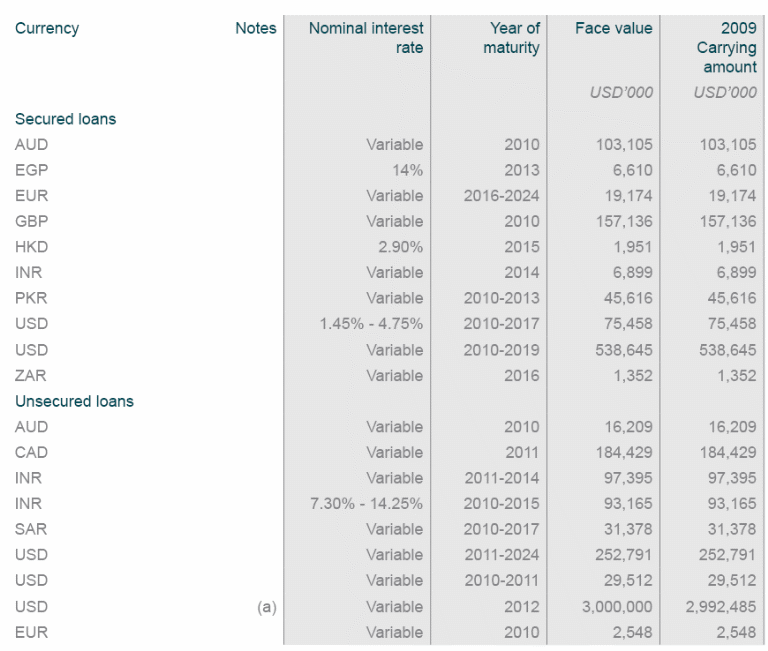
However, following figure 8 has noticed that at the peak hour of global recession as well as with high debt burden, in which mode DP World has repaid their debts. Here it should notice that the high debt burden of the company has not only an impact on economic strength but also decay political influences in the international regions, as well as an association since DP World and its associates in aggregate, are the second-largest economic supplier of UAE. Tough nerval pressure on both political and economic areas, UAE government has enforced to suggest DP World and its sister concerns to repay through an optimal level of skill and hence following is the latest scenario of DP World ton repay debt. (AAWSAT 1).
Expectation & Recommendations
Long-term investment of the company
Partnership with Australia
Last quarter of December 2010 DP World Limited another conglomerate of Dubai World has agreed on an investment deed with Citi Infrastructure Investors (CII). The strategic partnership aims to operate as well as manage five marine terminals located in Australia and additionally, the long-term investment agreement is to not only operate the marine terminals but also provide superior services to their current and potential customers. The point should to quoted that CII is one of the major investment associates of DP World and the five terminals of Australia is capable to execute about half (50 %) of the nation’s container market that carried an annual value of 3.50 million TEU.
Alternatively, this joint venture during 2009 was able to generate AUS$ 96.0 million EBITDA (adjusted). Moreover, in the Australian stock market, DP World has crafted to monetize 75.0 % of their shares, which was hold the closing value of AUS$ 1,817 million. As a consequence of this, DP Worlds Limited has now analyzed to get USD 1.50 billion in terms of repayment from the DP World Australia as well as inter company balances according to investment deed. As a result, day after day DP World’s debt value is decreasing; making the balance sheet more flexible, and regulatory approvals would be resolved within the first quarter of 2001 (Lockie and Natasha 1–4).
Joint venture with the MGM Mirage
Another significant long–term investment segment of Dubai World is to invest USD 2.70 million with an equal partnership joint venture located in MGM Mirage–Las Vegas. Both the partners of this agreement are desire to occupy about USD 5.0 billion and additionally, USD 2.40 billion by purchasing common stocks of the MGM Mirage. The key vision of the investment portfolio is to form a rich global portfolio for future generations through which they would be able to get superior valued signature properties.
Moreover, this international portfolio is also desired to provide an unparallel luxury lifestyle with modern attributes, assemble and integration, and supply of outstanding factors of art, culture, and design, and finally, has strong potentiality cover an important segment of United State’s housing and construction markets. For instance, resort casinos are attributed by 4,000 rooms along with dazzling architectural design. On the other hand, this agreement would be generated durable revenues therefore, the balance sheet of Dubai World will be more profound as well as flexible, will occupy a rich growth rate, and more share purchasing skills (MGM MIRAGE 1–3).
Total income of the company
The term total income of a company is also known as total revenue or the total profit of the firm during a certain financial time. In a simpler form, the calculation of total income is operated by subtracting total expenses over a year from total gross profit. Alternatively, the total income of a company is also termed as the percentage (%) of the gross income of a business firm before tax payment and property value before expense payment. At the end of 31 December 2009, the calculation for Total Income of DP World is performed following table (DP World 19- 81).
DP World Limited. Net Profit Calculation At the end of 31 December 2009.
Table 5: Net Profit Calculation.
Efficient use of resources
Developments programs of Dubai World are more aware of the utilization of resources that have a significant impact on the environment as well as the economic development of UAE. Some of them are included –
- low carbon–dioxide wastage infrastructure to protect and prevent global warming as well as potential climate changes and additionally, encourage national and international inhabitants to save energy resources for future generation,
- Effective use of land properties therefore, in the future UAE would not be in a crisis of over density,
- Urban mining is now a great challenge o for Dubai World’s construction projects as a result it has urgent for their sister concerns to expert in waste management and considering this point, Dubai World has not yet let their credit or debt crunch turn into a waste crunch as a matter of global environment’s anxiety,
- Besides real estate dilemmas, industrial waste management is also a considerable challenge for Dubai World, and in this case, they are corresponding efficient by recycling oil wastage, use of effective methods for managing industrial hazards in the UAE,
- other than these major areas of utilization of the resources efficiently, there have several miscellaneous sectors such as controlling domestic wastage, recycling energy wastage, joining with the Dubai municipality Vision of zero (0) wastage, and making trade-offs among private enterprises for wastage management where they succeed though suffering severe debt load (UNEP 5).
Green Building Regulations
In the light of Strategic Plan 2015 by the UAE Government proposed and approved in 2007 at an early stage of Dubai World aimed to follow green building regulations to make the nation as a unique model for the GCC members. Therefore, being a public limited holdings company Dubai World has joined to work with the vision by fulfilling nominal critical sustainability issues such as efficient use of energy wastage management as well as a waste of water management. Alternatively, the regulation has no enforceability to achieving stringent requisites but UAE has continuously encouraged these initiatives like campaigns for efficient utilization of natural resources are always welcome without any compromise (EHSD 2–15).
Expected company’s position in five years
Dubai World and its associates are established by a decree of the former government during 2006 as a result they have passed their first fiver year just in the previous year 2010. At the beginning of their journey have experienced enormous success since late 2008 before the crash of the global financial recession as well as a large amount of debt liability. Under this circumstance of Dubai World, the following segment consists of expected five years position both domestic and international market along with poor experience of recession focusing most significant conglomerate DPW.
Key Success Factors within First Five Years
Desired to achieve a leading market position within first five years and within 2009 Dubai World is indispensable from UAE economy moreover, they have now treated as the second-largest economy of the country. With the improvement of market shares, DPW would have also occupied increasing terminal productivity. Conversely, 74.0 % of the industrial utilization has also a strong potentiality to across successfully 78.0 % without including newly issued terminals.
Moreover, wished to deduct 7.0 % of aggregate fixed costs by 2009 which would be able to reduce (3.0–4.0) % of aggregate costs of the firm and in addition, current EBITA will get better by the last quarter of 2009 with available matured debts. The key success of the fifth year of DPW is that they have already gotten prepared to open new more terminals abroad as well as continue effective investment portfolios. (DP World 2–25)
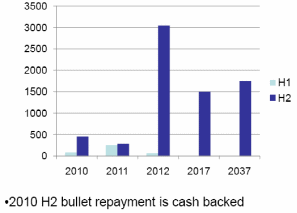
The figure number 14 graph attributed that at the end of their fifth year how was their economic status in defining five years financial position and in addition, the figure has predicted how would be the potential financial scenario. In describing the financial status of DP World here it should convey that both domestically and internationally, DP World has ruled a pioneering role for the first four years of their journey, and consequently, the shock of recession drops them into a poor experience. Hence, their enormous success turns into harassment by losing in the stock market as well as in aggregate sales volume.
However, H1 and H2 in the following figure are two symbols to define debt versus cash repayment status respectively, from 2010 to 2037 where 2010 represents the Company’s financial status at the end of year five and the rest of the periods are forecasts by Business Analysts of DP World.
Impact of Global recession On Company’s Expected Position
Investment analyst of DP World claimed that since of global recession 2009 is the most challenging year for their survival and their debt liabilities turn them into severe insolvency therefore, bankruptcy will be a matter of time and convey the earnest request to their creditors to extend debt repayment time in favor of their survival. The year 2009, firstly face a dramatic decline of their global volume by 11.60 %.
For instance, during 2008 DPW’s global volume was 525 million TEU whereas it was about 464 million TEU during 2009. Conversely, compared to the Stock Market, DPW has earned 43.40 million TEU gross profits, which were 6.0 % lower than the previous year. In the case of aggregate profit in 2009 was 25.60 million, which was 8.0 % lower than the previous operating period, and group and associates volume profit reduced by 10.0 %. More specifically, based on the UAE economic profile DPW has been able to contribute only 11.10 % and compared to the previous operating year is 6.0 % less. (DP World 3–19)
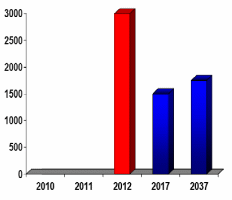
Figure number 15 describes the impact of the global recession on DPW’s expected financial position, following graph has portrayed the debt maturity profile from 2010 to 2037. Where scenario of 2010 has already passed over the company, which has 6.0 % lower than the prior year, and the rest of the segmented time profile has forecasted with consistent of recession recovery rate. Hypothetically, it has been revealed that recession is a circular flow that arrived after every ten years later. Concerning this view, within 2012, with a satisfactory recovery, DP World has under threat of another re
Recommendations
Financial analysis of DP World is the key focus of the paper featuring three phases of the period before recession, during the recession, and after the recession as well as considering the impact on the recession of the entity. This part has dispensed to draw suitable recommendations to overcome cresses in consequence of recession impact and following are the numerous rescue path of DP World through which they would recover as soon as possible.
- Equity Market: continuous downward of sales volume has considerably declined confidence of the equity holders, as a result, it has better for the corporate bodies of DP World to stimulate equity holders with new projects and effective debt return policies. Moreover, DP World has also focused on their overseas market to explore business volume, and thus diminishing equity market would recover gradually.
- Improvement of Sales Volume: it has been illustrated earlier that DP World has failed to keep its sales growth during the recession period of July 2008 to October 2009 and consequently, lost USD 0.04 billion. On the other hand, the transaction of properties in the area of the real estate segment has exceedingly precarious and hence, it has emergent to boost sales volume in both domestic and international markets with pioneering and trustworthy projects to rescue from recessionary impact.
- Lessen Debt Liabilities: debt liability is another issue of DP World through which the entity has severely stalked. The earlier discussion on debt liability noticed that amongst significant sister concerns Nakheel has in the debt burden of USD 12 billion and Sukuk official member of the London Exchange has crafted a loan of USD 2 billion. In aggregate debt liability of the group has been too shocking and hence the government has expanded a helping hand by issuing a Decree to rescue from bankruptcy. It’s an effective approach to support DP World but other than this, the Group is in the emergence stage to join with the domestic and international business associations to get entered into a new market, the new potentiality of flourishing with new products and services. In this way DP World, hope to return their debt burden promptly.
- Expansion of Capital Market: to rescue from debt burden, Abu Dhabi has enlarged significant accommodation by lending a large amount of investment but this has not yet enough sound to recover crisis. Regarding this point, it has urgent for DP World to issue more ordinary shares as well as their two fixed-rate official bonds in an adequate amount to assemble a stronger capital volume. Since strong capital volume has strong proficiency to reduce dependency on loans like lending from basking, mortgage of assets and official properties and investors sponsor. Besides issuance of capital volume, it has enough urgent to strict monitor of the stock market to prevent vast fluctuation, which is another reason for downfall during the recession.
- Amendment of Fiscal Policies and Monetary Fund: vast amendment in fiscal policies of UAE along with monetary fund would afford through wash away all type of embezzlement through which fraudulent in the stock market as well as in company’s internal and external auditing would rather fair than now. Another involvement of the amendment would support DP World to accumulate more investment and thus their current financial crisis would move towards a suitable solution. Meanwhile, the transformation of official assets and properties will also get new hope not to sell, mortgage, or any type of decay that reduces the asset value of the company.
Requirement 4: Figure for the Interest Rate
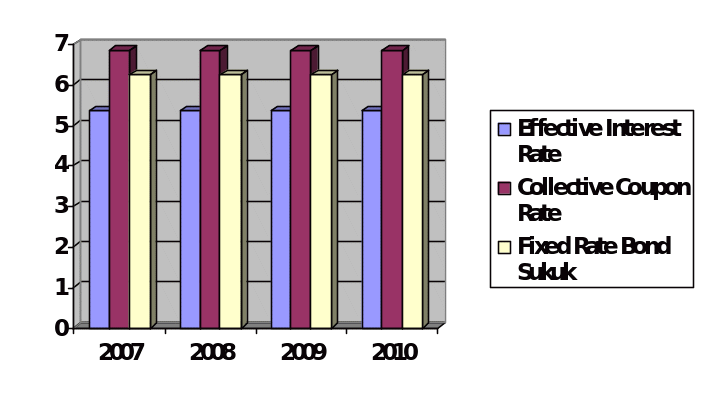
Hypothetically, the interest rate of a firm is treated as official liability and a low-interest rate brought high profitability, and conversely, a high-interest rate decreases profit volume. By the requirement of the paper, the interest rate of DP World has presented in this part from 2007 to 2010 where the company’s aggregate effective interest rate on debt maturity has remained constant, 5.35 % and in addition, the collective coupon rate on outstanding debt value has represented an unchanged figure, 6.85 % for four years. In the end, the company’s official fixed rate bond Sukuk attributed with a constant profit rate of 6.25 %.
For more clarification, the following is the table of four years interest rates following a detailed figure of each year. (DP World 2007 30 & 40, DP World 2008 48 & 72, DP World Limited and Its Subsidiaries 52, DP World 2009 58 & 76, DP World 2010 53 & 62)
Table: DP World Interest Rate (Source: DP World 2007 30 & 40, DP World 2008 48 & 72, DP World Limited and Its Subsidiaries 52, DP World 2009 58 & 76, DP World 2010 53 & 62)
Limitations
It was difficult to find out actual data for calculation, as the annual reports did not include all the necessary data for calculation. As a result, I have to calculate by considering a systematic method that means a huge calculation has to conduct to identify another simple piece of data, which was a really difficult task for me. On the other hand, the deadline was not sufficient to conduct such a difficult job but I worked hard to overcome such a problem. In addition, Dubai World has many subsidiaries but I cannot analyze the ratios of all the portfolios due to lack of financial information and unavailability of annual reports.
Conclusion
This paper is assigned to illustrate the financial analysis of Dubai World and the impact of the global recession on the economy of the UAE. Dubai World is one of the most significant economic assets of the UAE government. Considering organizational structure as well as stakeholders profile Dubai World has a significant influence on political and economic area of UAE and their international associates. It has already been pointed that currently, Dubai World is the second-largest economic contributor of the UAE though since late 2008 this entity and its associates have suffered a harsh debt liability.
To recover from this crisis, the government has newly issued a favorable Decree to prevent their bankruptcy as well as relevant Insolvency Constitutional obligations. On behalf of economists’ analysis of UAE and advisors of the country strictly recommended not letting the entity wind up in favor of the country’s urban and rural development along with regenerate tourism sectors. On the other hand, Dubai World has enlisted in the London Stock Exchange as of Sukhuk and before late 2008 average market price of their share is positioned top of the market. As a result, Dubai World was then failed to collect funds for debt repayment from the share market but did not let a single chance to debt repayment by investing in Las Vegas development as well as in India to earn about 25 % of their profit within 2012.
At the end of this part, in the light of struggle and enormous success within a few years of their establishment it has assertively stated that Dubai World is an integral part of developing the UAE’s economy with countless prospects. Meanwhile, it would be rather fruitful to seek a new market in the developing countries especially in the South Asian region as well as emerging African nations to expand the business volume and reduce debt liability as well. Conversely, it has urgent to redesign UAE’s fiscal policies and monetary fund for fair investment and auditing thus DPW would explore soundly with their expectation.
Note
- CSX World = CSX Corporation established in 1980 in the USA and DP World acquired this company $300 million in 2004, which is known as CSX World Terminals
- P and O’s = It is also a company Peninsular and Oriental Steam Navigation Company (P&O), which DP World purchased
- Sukuk trade at 60¢ = 60 cents
- GB = It would be DG (Dubai Government)
- CDS = Certificates of deposit
- H1 and H2 = H1 and H2 are two symbols to define debt versus cash repayment status respectively, from 2010 to 2037 where 2010 represents the Company’s financial status at the end of year five and the rest of the periods are forecasted by Business Analysts of DP World.
Works Cited
AAWSAT. Dubai World Sale of Crown Jewels Seen as Last Option. 2010. Web.
ABAHE. Financial Ratios. 2011. Web.
Advameg. History of DP World. 2011. Web.
Astorri, Carl. Jean-Maurice Ladure. and Henry Lancaster. The news from Dubai. 2009. Web.
BBC. Dubai World debt ‘not guaranteed by the government. 2009. Web.
Block, Stanley. and Geoffrey Hirt. Foundations of Financial Management. NY: McGraw–Hill, NY, 2009. Print.
CNN. Explainer: What is Dubai World? 2009. Web.
Crouse, Alissa. Paul Hastings Advises Dubai World in CityCenter Holdings’ $2 Billion Financing. 2011. Web.
DP World. Annual Report 2007 of DP World. 2007. Web.
DP World. Annual Report 2008 of DP World. 2008. Web.
DP World. Annual Report 2009 of DP World. 2009. Web.
DP World. DP World Investor Presentation. 2010. Web.
DP World. Preliminary Results 2009. 2010. Web.
Drake, Pamela Peterson. Financial Ratio Analysis. 2011. Web.
Drydocks World. About Us: Mission, Vision, Corporate Governance. 2008. Web.
Dubai World. About Us. 2011. Web.
DWSC. Dubai Financial Support Fund to spearhead restructuring of Dubai World. 2009. Web.
EHSD. Green Building Regulations for Dubai World Developments. 2008. Web.
EZW. Economic Zones World. 2011. Web.
Global Investment House. UAE Economic & Strategic Outlook. 2009. Web.
Gowealthy. How hard will UAE’s economic growth be hit by the Global Recession? 2009. Web.
IMF. United Arab Emirates: 2009 Article IV Consultation—Staff Report; Public Information Notice; and Statement by the Executive Director for the United Arab Emirates. 2010. Web.
Istithmar World. Company Profile: Istithmar World. 2011. Web.
Heyer, Hazel. Dubai: Not recession-proof after all, unemployment shows. 2008. Web.
Hoover’s Inc. Dubai World · Company Description. 2011. Web.
Lockie, Sarah. and Natasha Bukhari. DP World and City Infrastructure Investors form strategic partnerships in Australia. 2010. Web.
Matly, Michael. and Laura Dillon. Dubai Strategy: Past, Present, Future. 2007. Web.
MGM MIRAGE, MGM MIRAGE, and Dubai World to Form Long-Term Strategic Relationship. 2010. Web.
Property Week. Dubai World to merge Nakheel and Istithmar. 2007. Web.
Rainey, Michael. and Sara Carmody. King & Spalding: Dubai World Restructuring – Decree No. 57. 2009. Web.
Reuters. Dubai World assets over $120 billion. 2010. Web.
UNEP. Dubai Airport Expo Centre. 2009. Web.
Wadi, Share. EMAAR merger vs Dubai World default. 2009. Web.

