Executive summary
This paper carries out a financial analysis of Hutchison Whampoa Limited with the aim of pointing out the financial strengths and weaknesses of the company. Financial data for the Group for five year period that is from 2007 to 2011 is used. The study is based on a comparative analysis of historical data of the entity. It concentrates on the accounting policies used, ratio analysis (ratios of profitability, liquidity, financial gearing and efficiency) and perception of the market for the performance of the stock prices. Graphs are also used to portray the trend of various variables in the study over the two-year period. The results are interpreted in comparison with ideal situations and recommendations are made based on the findings to advise a potential investor on the viability of investing in the company.
Financial Ratio Analysis
About the company
Hutchison Whampoa Limited, formed in 1863, is a publicly-traded company based in Hong Kong, China. It is the largest company trading on the Hong Kong Stock Exchange. Its ticker symbol is SEHK: 0013 and OTC Pink: HUWHY. It is a multinational company with a presence in over 10 countries under three brand names. As of 201, it had about 253,983 employees. It is an investment holding company that trades in a variety of industries such as telecommunication, infrastructure, retail, finance, property, hotels and investment among others (Hutchison Whampoa Limited 2012).
Accounting policies
Accounting principles are the regulations and guidelines used in recording and preparing financial statements. The financial statements of the company are prepared in compliance with Hong Kong Financial Reporting Standards (HKFRS). These reporting standards are issued by the Hong Kong Institute of Certified Public Accountants. The financial statements are drawn up on the historical cost basis for depreciation of assets are computed based on the historical book value of the assets and not the market value except for financial instruments which are reported at market value. Another accounting policy used is the going concern principle.
This principle assumes that an entity will remain in operation for the foreseeable future. The board of directors of the company is satisfied that the group will be able to operate within the level of its facilities for the foreseeable future. Further, the Group adopted the revenue recognition and matching principles as revenue is recognized when the significant risks and rewards of ownership have been transferred to the buyer and revenue from sales of recorded on the delivery of the goods to the customer (Hutchison Whampoa Limited 2007; Hutchison Whampoa Limited 2008; Hutchison Whampoa Limited 2009; Hutchison Whampoa Limited 2010; Hutchison Whampoa Limited 2011)
Finally, there is the use of the time period principle. Transactions are recorded in the period they occurred. From the review of the financial statements, it is evident that the accounting principles used by the Group are consistent with the Generally Accepted Accounting Principles (GAAP) (McLaney & Atrill 2008). Further, there has been no change in the accounting principles used by the Group during the period of review.
Analysis of financial strengths and weaknesses of the Group
Financial statements provide a potential investor with a narrow insight into the financial strengths and weaknesses of the Group because reported values do not give an in-depth description of the performance of an entity. The financial analysis breaks down the financial data into various components for better understanding. The ratios will focus on the profitability, liquidity, efficiency, and gearing of the company from 2007 to 2011. The analysis will also entail coming up with graphs to show the trend of performance over the five-year period (Eugene & Michael 2009; Atrill 2009).
Liquidity ratios
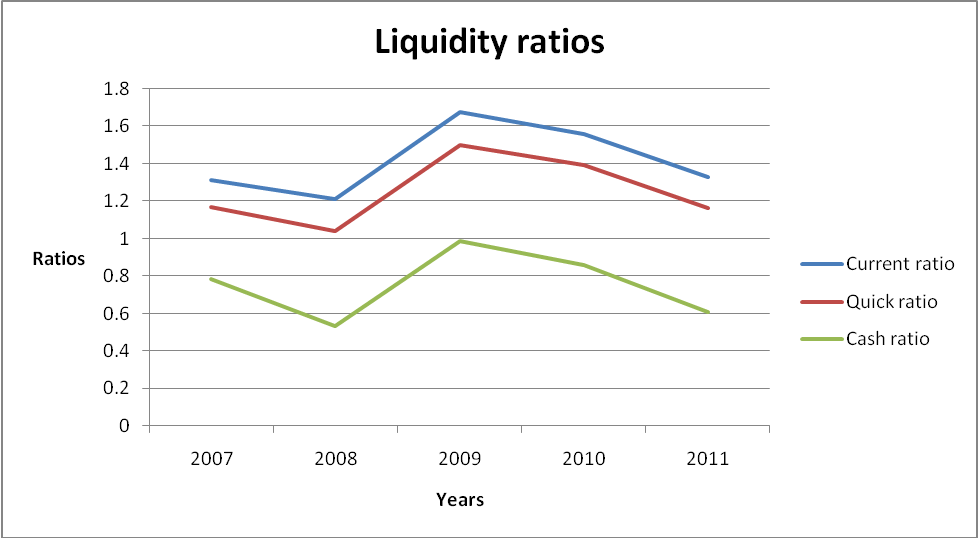
Analysis of liquidity is necessary as it establishes the ability of an organization to maintain positive cash flow while satisfying immediate obligations, that is, the availability of cash to pay current debt. The common ratios used to analyze liquidity are the current and quick ratios (Haber 2004; Brigham & Joel 2009). It is necessary to maintain optimal liquidity ratios since either low or very high ratios are not favorable. The table below summarizes the liquidity ratios for the Group.
From the table above, both current and quick ratios are greater than one. This implies that the company is in a financial position to meet current obligations as they fall due to using current and quick assets. The values of cash ratios are less than one but greater than 0.5. It is the most conservative measure of liquidity of a company. Despite the favorable liquidity, the trend of the ratios over the five-year period is erratic as shown in the graph below.
Profitability ratios
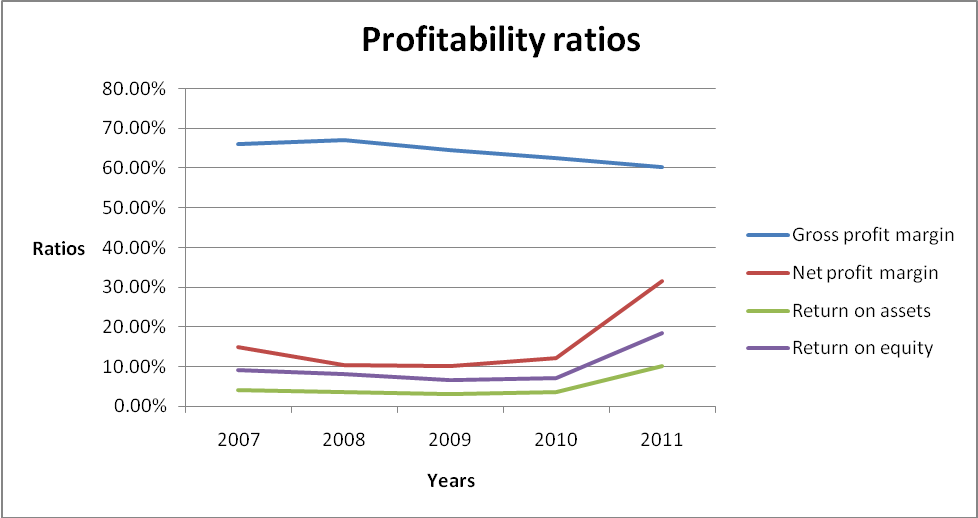
Profitability is the ability of an entity to earn income after excluding the cost of running a business. Various ratios are used to analyze profitability such as gross profit margin, operating profit margin, net profit margin, the return on assets (ROA) ratio, and the return on equity (ROE) ratio (Siddidui 2005; Head & Watson 2009). Profitability ratios are the main concern of most stakeholders in the organization. The table below shows various profitability ratios over the five-year period.
Four ratios are computed to give more information on the profitability of the company. Gross profit margin shows how well a company manages its costs of sales and pricing so as to generate profit. The ratios are above 50% for the five-year period which is favorable though they are in a declining trend. The net profit margin shows how the company manages the cost of running the business. The ratio has been increasing over the five-year period which is a good indication. Return on assets shows how well a company uses assets to generate profits. Return on assets for the company is low with a declining trend between 2007 and 2010. Return on assets shows how well the company uses shareholders’ funds to generate revenue. Return on equity for the company is low. It indicates that the shareholders’ funds are not properly managed. The graph below shows the erratic trend of the four profitability ratios.
Efficiency ratios
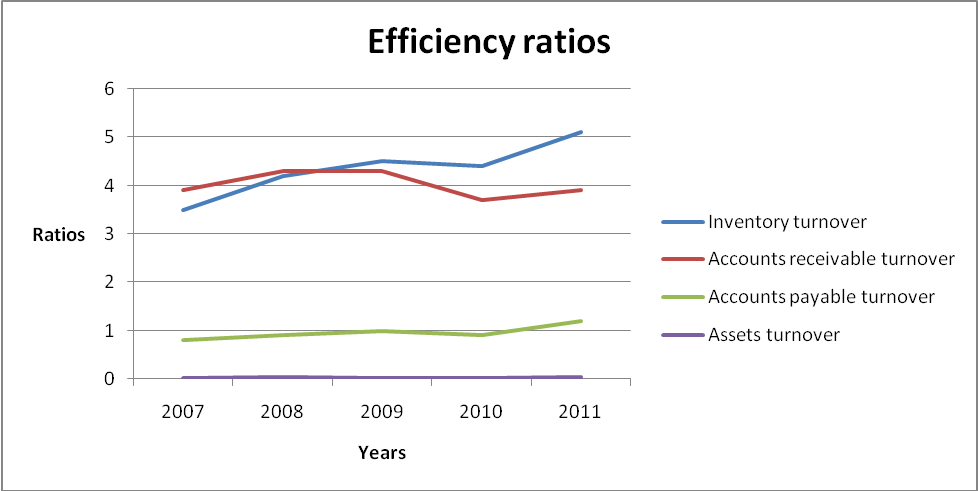
These ratios show the level of activity in a company, that is, how well a company manages resources to generate sales. Turnover ratios are the most commonly used to measure efficiency (Eugene & Michael 2009; Collier 2009). The table below shows the turnover ratio for the Group over the five-year period.
Four ratios are computed to ascertain the efficiency of the company. The inventory turnover ratio ranges between 3.5 and 5.1. The low ratio can be attributed to the slow-moving goods held by the company. Accounts receivable turnover ranged between 3.7 and 4.3. These ratios are very low and may indicate low levels of efficiency in the group. Accounts payable turnover ratios are low for the five-year period. They are favorable since a company needs to maintain low ratios. Asset turnover ratios are extremely low. This shows inefficiency in the use of assets to generate revenue. In summary, from the above ratios, it is evident that the Group is not efficient in managing resources to generate sales. The graph below shows the trend of efficiency for the five-year period.
Leverage ratios
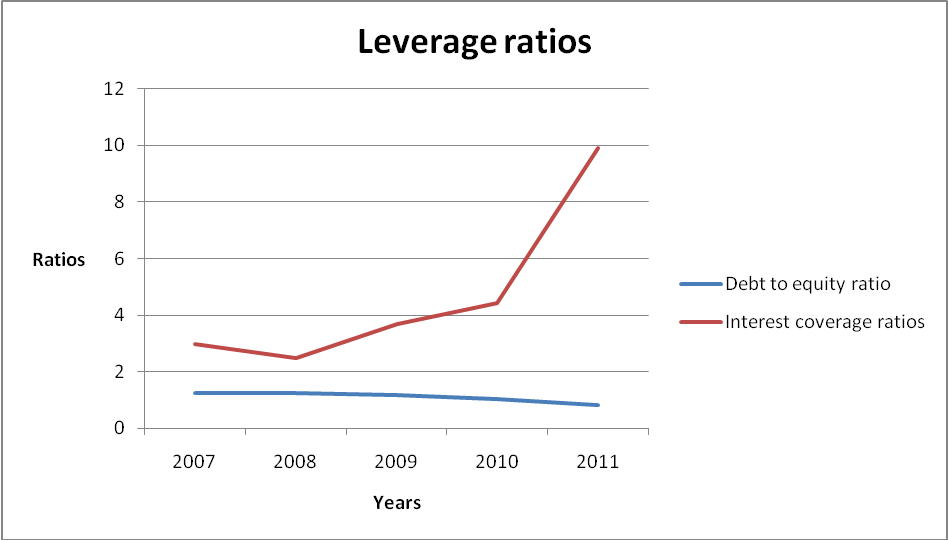
A company’s leverage is explained by the amount of debt financing it holds. The ratios are vital since they show the investor the extent of exposure of equity financing (Holmes & Sugden 2008). The table below shows leverages ratios for the company.
A high debt to equity ratio implies that has a very large amount of debt financing in relation to equity financing. This implies that shareholder wealth is at risk. A value that is close to one is favorable as in the case of the Group. The debt to equity ratio for the company ranges between 0.81 and 1.23. A high-interest coverage ratio is favorable since it shows that the company is not having difficulties in paying interest associated with debt. The ratios for the company ranged between 2.91 and 9.91 times. It is a good indication for a potential investor. The graph below shows the trend of the ratios for the five-year period.
Summary
From the ratio analysis above, it is evident that the company’s liquidity position is favorable, that is, they are able to meet current obligations. Further, the profitability of the company is quite dismal and it shows that the company is not attractive enough to invest in. The level of activity of the Group is quite low. Management of the Group does not efficiently use resources available to generate sales. Finally, the company’s leverage is favorable. The low performance recorded between 2008 and 2010 is attributed to the global financial crisis which impacted greatly on multinational companies trading in a number of currencies.
Market perception of the company
The market at large and analysts perceive the stock prices of the Group to be highly volatile. This shows the lack of financial stability of the company. The analysts state that “the market prices of the common stock are highly volatile and it’s likely to continue to be subject to wide fluctuations in response to a number of factors beyond the control of the management” (Securities and Exchanges 2006). There are numerous factors that analysts, the market and investors consider as the prime cause of the volatility of stock prices.
First, the volatility is attributed to variation in periodic financial performance. Another factor is that operating results and future expectations often vary from the expectation of securities analysts and investors. Further, the announcement of technological innovations, new services, significant contracts, acquisition, strategic partnerships, joint ventures and capital commitment contributes significantly to the volatility of the stock prices. It is worth noting that the Group trades in seven different sectors. These sectors face diverse risks and such risks impact negatively on the stock prices of the Group thus the volatility (Securities and Exchanges 2006). A potential investor should also take into account the nature of the industry in which the Group is operating before injecting funds into it.
References
Atrill, P. 2009. Financial management for decision-makers, Financial Times Prentice Hall, Harlow.
Brigham, F & Joel, F. 2009. Fundamentals of financial management, South-Western Cengage Learning, USA.
Collier, P. 2009. Accounting for managers, John Wiley & Sons Ltd, London.
Eugene, F & Michael, C. 2009. Financial management theory and practice, South-Western Cengage Learning, USA.
Haber, R 2004. Accounting dimistified, American Management Association, New York.
Holmes, G & Sugden, 2008. Interpreting company reports, Financial Times/Prentice Hall, Harlow.
Head, A & Watson, D. 2009. Corporate finance: principles & practice, Prentice-Hall, Harlow.
Hutchison Whampoa Limited 2007. 2007 annual report. Web.
Hutchison Whampoa Limited 2008. 2008 annual report. Web.
Hutchison Whampoa Limited 2009. 2009 annual report. Web.
Hutchison Whampoa Limited 2010. 2010 annual report. Web.
Hutchison Whampoa Limited 2011. 2011 annual report. Web.
Hutchison Whampoa Limited 2012. About HWL. Web.
McLaney, E & Atrill, P. 2008. Financial accounting for decision-makers, Prentice Hall Europe, Harlow.
Securities and Exchanges 2006. Prospectus supplement. Web.
Siddidui, 2005. Managerial economics and financial analysis, New age international (P) Limited, New Delhi.