Introduction
Microsoft Corporation has been the “king of the IT industry” (Lai). The company has maintained a leader’s position through a unique strategy of monopolizing the market share (Anderson and Wood; Whinston; McKenzie and Shughart II). The company is the undisputed leader in desktop operating systems.
Microsoft is a computer software business with various software related products and services. They develop, manufacture, license, and support software products for various computing devices (Datamonitor). They also develop MSN networks and internet products and services.
The company recorded revenue of $60420 million in 2008, which was an increase from 18.2 percent over 2007. However, it slipped by 3 percent in 2009, indicating a decline in revenue. Many speculations were put forward to explain this slum, one of which was the formal transition of power from Bill Gates to Steve Balmer (Lai). There has been increased pressure from competitors like Google. The unsuccessful acquisition trial of Yahoo also shattered the IT giant’s dream to rule the search engine war. Further, the impending recession cannot be overlooked. This paper will try to ascertain the main problem of Microsoft and the reasons behind them.
The aim of the paper is to understand the reason behind the problem, which will be unearthed after undertaking a background check and understanding of Microsoft. After the problem is identified, the paper will suggest a possible solution for the problem. Data collected for the company analysis has been collected from various secondary sources. First, an overall SWOT analysis is done to understand the overall situation of the company and then a BCG analysis is done to get a complete picture of the segment wise problem facing the company. In the end, the paper provides recommendations to remove the gap.
Background
Microsoft was founded in 1975 with the mission to “enable people and businesses throughout the world to realize their full potential” (Annual Report 2008). They develop software, services, hardware and solutions for work, play, and communication. The overall business of the company is divided into five main operating segments, which are Client, Server and Tools, Online Services Business, Microsoft Business Division, and Entertainment and Devices Division.
Client, the first segment, is responsible for handling all the technical, engineering, and sales of Windows and its related product family. This segment is responsible to create and maintaining the relationship of the company with personal computer manufacturers. This segment is responsible for expense for development and marketing for Windows and its product family, and sales. The products offerings under this segment is: Windows Vista, including Home, Home Premium, Ultimate, Business, Enterprise and Starter Edition; Windows XP Professional and Home; Media Center Edition; Tablet PC Edition; and other standard Windows operating systems. Therefore, for this segment we can dub that the offerings under this segment are Windows operating systems (OS) related products, which in this analysis will be called Windows. This segment faces competition from other OS suppliers like Apple, Hewlett-Packard, IBM, and Sun Microsystems. Windows OS faces competition from Linux, or Apple’s MAC. The Windows explorer faces competition from Morzilla, Google Chrome, Opera, and Apple Safari.
Servers and Tools develop and markets software server products, services, and solutions. The products offered in this segment are Windows Server operating system; Microsoft SQL Server; Microsoft Enterprise Services; product support services; Visual Studio; System Center products; Forefront security products; Biz Talk Server; MSDN; and other products and services. The main competitors in this segment are Hewlett-Packard, IBM, and Sun Microsystems.
Online Services Business (OSB) consists of on-line advertising platform, which offers publishers and advertisers, personal communications services, online information offerings (e.g. Live Search), and the MSN portals and channels. The products under this segment are Live Search; MSN; MapPoint; MSN Internet Access; MSN Premium Web Services (consisting of MSN Internet Software Subscription, MSN Hotmail Plus, and MSN Software Services); Windows Live; MSN Mobile Services; AvenueA Razorfish media agency services; Atlas online tools for advertisers; and the Drive PM ad network for publishers. The main competitors of Microsoft in this segment are AOL, Google, Yahoo!, and a wide array of Web sites and portals that provide content and online offerings of all types to end users.
Microsoft Business Division (MBD) segment offers Microsoft office systems and business solutions. Microsoft office forms 90 percent of the MBD revenue (Annual Report 2008). The main competitors in this segment are “Apple, Corel, Google, IBM, Novell, Oracle, Red Hat, Sun Microsystems” (Annual Report 2008), and regional application developers.
Entertainment and Devices Division (EDD) is responsible to develop, produce, and market “Xbox video game system, including consoles and accessories, third-party games, games published under the Microsoft brand” (Annual Report 2008). The main products in this segment are Xbox 360 games, Xbox Live, Zune, Mediaroom, and Windows Mobile software and services. Competitors in the Xbox hardware business are Nintendo and Sony. Zune is a music storing hardware, which competes directly with Apple iPod and other digital music and entertainment devices. As far as the Windows Mobile is concerned, it faces direct competition from Apple, Nokia, Openwave Systems, Palm, Symbian, etc.
Financial Position
The share of each business segment to the overall revenue in 2008 and 2009 is shown in figure 1. This shows that the main share to the revenue is from Client segment, which handles Windows product family, Microsoft business division that comprises of Microsoft office and Dynamics, Microsoft office having an 80 percent share in its revenue, and server and tools. A comparison of the share to revenue of the segments in 2008 and 2009 reveal that the shares increased for Windows by 2 percent, while that of Server and Tools, and Microsoft Business division declined. There was a marginal increase in online services business and entertainment devices division.
Figure 1: Share in revenue 2009, source: Microsoft corporation.
On analyzing the historical data for growth in revenue (see figure 2), operating income and diluted earnings per share is shown in figure 2. This shows that the growth rate of Microsoft had increased from 2006 to 2007 and from 2007 to 2008. However, the growth rate in all three measures became negative in 2008-09. This indicates that the growth of the company had reduced. The growth became negative in 2009 demonstrating a decline of 21 percent from the previous year’s growth rate.
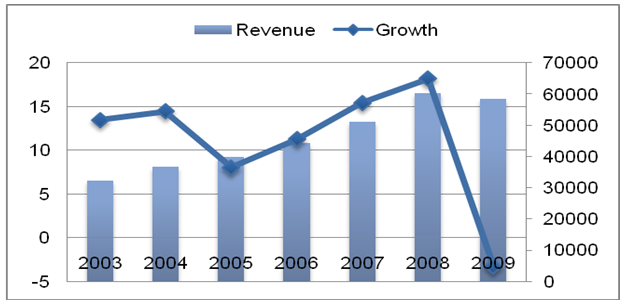
Further, the segment wise growth rate shows (see Appendix, Table 2) that the growth rate of the Windows segment had gone down from 13 percent in 2008 to -15 percent in 2009. Further online services as well as entertainment segments also faced a negative growth rate in 2009. Microsoft Business Division had zero growth rates. The growth rate for server and tools segment too was lesser in 2009 than what it was in 2008.
Problem statement
The main problem with Microsoft Corporation is its growth. Revenue for the company is not a problem as the company itself is a source of income. The company enjoys an absolute monopolistic power for its Windows operating systems. The main problem that arises is growth rate. The growth rate of the business has become negative in 2006.
A more detailed segment wise analysis shows that the segments which faced a negative growth rate in 2008, even after experiencing a positive double digit growth rate are were Windows, Online services, and Entertainment segment. The growth rates of the segments dwindled in 2009, indicating that the company was growing at a slower rate. Evidently, there exists a gap in the expected growth rate as the intended sustainable long-term growth, was not achieved (Annual Report 2008).
Company Analysis
Microsoft is the number one software company in the world. However, the company is facing a decline in its growth rate. The problem arises due to a double-digit decline in the growth rate of the main revenue generating segments of the company. Overall, the company faced a negative growth rate.
BCG Analysis
In order to understand the nature of the product portfolio and the strategy that needs to be taken, Boston Consulting Group (BCG) product portfolio matrix is employed. BCG matrix would allow analyzing the corporate strategy of Microsoft vis-à-vis its market growth and market share (Hambrick, Macmillan and Day; Hax and Majluf). Market growth rate is the rate of growth of revenue of the company for a year vis-à-vis previous year which provides a “static picture of the corporation at that time” (Hax and Majluf 47). Relative market share may be defined as “a ratio for the sales of a business against those of the most important competitor” (48). This analysis is done to find the attractiveness of the business segments of Microsoft.
The market growth rate for 2008 for all the segments are derived from company financial data and market shares are derived from various sources (Market Share; Arrington; Annual Report 2008). The cut-off for high growth rate is derived from the growth rate1 of the global software industry (Hax and Majluf). The cut-off for relative market share is 1 as logarithmic scale is considered for the horizontal axis (Hax and Majluf).
According to figure 3, the segments, which are the cash cows in Microsoft’s business, segments are Windows Product family and Microsoft Business Division. Clearly, these two segments are the source of cash for the company. The server and tools segment falls in the cross section of all the boxes in the matrix indicating that Microsoft need to concentrate on this segment to make it a star. The question marks box has two segments: online services, entertainment, and devices. According to Hax and Majluf:
“The Question Marks (in the upper right quadrant) are major untapped opportunities, very attractive because of the high market growth they enjoy. However, they have not achieved significant shares of their markets. Those businesses among them that can be successfully promoted to a leading position must be identified before committing the necessary large amounts of cash to them.” (50)
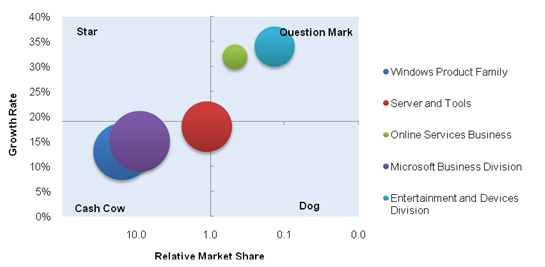
Thus, Microsoft has clearly seen the potential in these two markets but has been unable to tap the full potentiality of these segments.
SWOT Analysis
Strength
Microsoft has had a very consistent financial performance. The financial performance has been very strong for the past few years. A BCG analysis shows that Microsoft’s main revenue earners have been windows and allied products, which it sold to individuals, OEM, and offices, and business division software.
Entry into the internet business segment has allowed Microsoft to enter an industry which is growing at a very fast pace. Further, with proper innovation and strategy applied, this segment can be moved from the question mark cell to star as this cell implies that the product is capable of reaping more return that what it is doing at preset. Similar trend has been observed in case of the entertainment segment.
The company’s balance sheet is strong. Microsoft has cash and cash equivalent of $23.7 billion and $23.4 billion in 2008 and 2007 respectively (Annual Report 2008). Cash flow from operations increased by $3.8 billion due to an increase in revenue growth by 18 percent in 2008.
Recently Microsoft has invested in Facebook, which increases its presence in the online community like Google’s Orkut. Microsoft acquired BigPark Inc., which is an online interactive gaming company. This enhanced the company’s entertainment segment (Microsoft News Press Release).
The company’s research and development activities are focused on consumer technology. They also concentrate on software plus services, and expanding their presence in PC, servers, and with developers. Presently the research and development investment is targeted to develop new products and technologies in order to develop new products and combat the short product life cycles of computer software industry. The company’s inclination on a strong research and development makes the company hold a strong position and helps them to launch a wide range of new products.
Weakness
Microsoft’s depleting brand image is a problem that the company faces. It has been a strong brand since inception. However, a recent brand survey shows that its rank fell from 38 in 2006 to 58 in 2007 ( Seattle Times).
One weakness that has crept into Microsoft is MSN and its low market share. This has actually made the segment (online services) a question mark. The potential of growth of online services in unquestionable, given the success of Google. MSN’s search engine had a share of only 9.8 percent in 2007 when Google captured a share of 58.4 percent and Yahoo retained 22.9 percent in 2007 (Datamonitor). As the company has future strategy of generating revenue through online services, the lack of growth of MSN could be a possible set back.
Windows Vista has experienced a diabolically slow adoption rate (Datamonitor). As pointed out by Lai: “home users hate it, businesses are uninstalling it and — according to Gartner Inc. — it’s proof that the 23-year-old Windows line is “collapsing” under its own weight.” (Lai 10) Microsoft’s intentional decrease in the price of Vista indicates that users have not upgraded to it. The problems related to slow adoption of Vista pertained to the following reasons:
- Problems related to the application installation process and driver, hardware, and software compatibility has resulted into slow adoption.
- Business acceptance of Vista has been slow. Vista was running in 8.8 percent enterprise PCs globally. Even after the release of Service Pack 1 (SP1), Vista has not been adopted by enterprises. The OS has problems namely OEM BIOS and 2099 Grace Time has not been solved by SP1.
- Consumers were concerned about incompatibility of the OS and functionality was another reason for resistance for adoption of Vista.
- Another problem that Vista has faced was recession. The present recession has prevented many individual users as well as enterprises to upgrade to Vista from XP (Lai).
- Another issue to adoption was Microsoft’s announcement of Vista’s successor Windows 7 which has made many users to skip Vista and wait for Windows 7.
In 2008, Microsoft was fined $1.3 billion in anti-trust regulation issue by European Union (EU) (Datamonitor). Microsoft’s monopolistic dominance in the software market was contested against, and was the third fine levied against Microsoft in the same dispute. Microsoft has been fined a total of $2.5 billion. Even though such huge fines are not a financial burden on the company, rather it is likely to have an ill effect on the reputation of the company.
The financial performance of Microsoft has been very strong throughout expect for a decline in revenue by 3 percent in 2009. The company faced a decline in growth in overall as well as in most revenue generating segments of its business i.e. Windows OS and business division. Such an unprecedented decline in growth is a serious weakness that the company currently faces.
Change in leadership from Bill gates to Steve Balmer has increased speculations regarding the company. According to many Gates was the creator of the “competitive drive” of the company, which drove the company to create monopoly positions in the market, which has been missing after Gates stepped down as CEO (Lai).
Opportunities
Microsoft is inclined in perusing the consumer technology and online services domain. Both these segments have extreme potential as both these segments can be found in the questions mark section of the matrix. The company is trying to get directly to the consumer with its products Vista, Office 2007, Xbox 360, Windows Live, Zune, etc.
In order to enter further into the consumer technology market, Microsoft has entered into a patent cross licensing with Pioneer in 2008 to foster innovation in consumer technology jointly.
With the increased importance of virtualization, has increased the need to optimize hardware utilization and has become a mainstream concept. The global data centre services market is forecasted to post a CAGR of 7 percent during 2007-12 (Datamonitor).
Visualization has been the means to reduce cost. According to Datamonitor:
“In August 2008, Microsoft cut the cost of running virtual Windows servers, and released version 4.5 of its Application Virtualization software for desktops, alongside other v-word related updates. The company released Microsoft Hyper-V Server 2008 in October 2008.” (Datamonitor 35)
The company’s adoption of software plus services has helped the company to enter the internet-based services with the power of desktop and server software. Microsoft introduced Windows Live in 2007, and then launched it for Mobile operations. It also launched developer software like Silverlight, Popfly, and the Microsoft.NET 3.0 Framework.
Threats
Intense competition in the software market has been a threat to Microsoft. One threat is described by Lai: “Microsoft-controlled standardization of IT is being challenged by proponents of open document formats, while open-source software. Web 2.0 technologies and software-as-a-service (SaaS) offerings are nipping away at Microsoft’s lucrative Windows and Office franchises.” (12) The chief competitor in this respect is Google. Google Chrome OS and Android are also expected to reduce Windows dominance to a certain extent (Cusumano; Fried).
Microsoft had been increasing the process of their OS earlier, which they failed to anymore due to Google and its unique search engine advertisement based revenue model (Hagiu and Yoffie). Microsoft tried to acquire Yahoo but was unsuccessful, which was another failure on the company’s part to attain internet presence and thwart increasing threat from Google (Lai).
A new revenue model developed by new commercial software is that software is provided free while Microsoft’s model has been attaining revenue for the software license. This is a challenge to the company. Increasing threat of piracy of software is a threat to the software products.
Fishbone Diagram
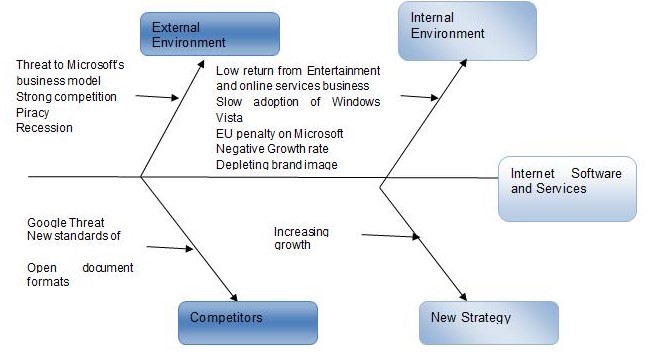
Figure 4 shows a fishbone diagram, which represents the cause and effect of the strategy that has been suggested to Microsoft. As the external and internal environment aim at increasing growth and threat from competitors who are aiming at making new online based to attain consumer with the use of a new business model, Microsoft too must try to attain the market, which the competitors are gaining through a new strategy. The new strategy is to expand in the online software services.
Conclusion
The solution to the problem that Microsoft faces is seen through the BCG matrix. The revenue that Microsoft earns presently is not the problem but the problem as foreseen is the growth. Growth of the company may be thwarted for the reason present in the above analysis. The only possible solution to increase in growth is through two methods:
- Increase the presence of the company in the internet software and service business, which would allow it to alter its business model. Attain upward momentum from the gaming or entertainment segment of the company, which presently loses money.
- Investing more wisely into new ventures, rather than acquiring anything that is available in to be acquired or invested in.
Table 1. Gantt Chart.
References
- Seattle Times. Microsoft brand sinks in this survey. 2008.
- Anderson, Jamie and Robin Wood. “Seven management Lessons from Microsoft.” Business Strategy Review 13(3) (2002): 28-33.
- Annual Report 2008. Microsoft Corporation Annual Report. Microsoft Corporation.
- Arrington, Michael. “The Empire Strikes Back: Our Analysis Of Microsoft Live Search Cashback.” 2008. Washington Post.
- Cusumano, Michael A. “What Road Ahead for Microsoft the Company?” Technology Strategy and Management Vol. 50 No. 2 (2007): 15-18.
- Datamonitor. Microsoft Corporation. Company Profile. New York: Datamonitor, 2008.
- Fried, Ina. “Ballmer: Windows will get more competition.” 2009. CNET News.
- Hagiu, Andrei and David B. Yoffie. “What’s your Google strategy?” Harvard Business Review (2009): 74-81.
- Hambrick, Donald C., Ian C. Macmillan and Diana L. Day. “Strategic Attributes and Performance in the BCG Matrix— A PIMS-Based Analysis of Industrial Product Businesse.” Academy of Management Journal Vol.25 No. 3 (1982): 510-531.
- Hax, Arnoldo C. and Nicolas S. Majluf. “The Use Of The Growth-Share Matrix In Strategic Planning.” Interfaces Vol. 13 No. 1 (1983): 46-60.
- Lai, Eric. “Microsoft’s Golden Age: Going, Going… Gone?” Computerworld 2008: 12-13.
- Market Share. Market Share. 2009.
- McKenzie, Richard B. and William F. Shughart II. “Is Microsoft a Monopolist?” Indepedent review 3(2) (1998).
- Microsoft News Press Release. “Microsoft Agrees to Acquire BigPark Inc.” 2009. Microsoft. Web.
- Whinston, Michael D. “Exclusivity and Tying in US v. Microsoft: What we know adn Don’t know.” Journal of Economic Perspective 15(2) (2001): 63-80.
Appendix A
Table 1: Summary of results for fiscal years 2009, 2008, 2007, and 2006.
Table 2: Segment growth rate.
Footnotes
- The CAGR of global computer software industry is 8.5 percent. This was considered as Hax & Majluf suggested that the cut-off should be growth rate of the industry if the company belongs to one specific industry and does not have diversified and unrelated operations.