Executive Summary
This paper demonstrates the use of real financial data in financial analysis in decision-making for potential investors. The objective is to carry out a broad financial analysis for Deltic Timber Corporation. It explores the various techniques and tools used for financial analysis. The study is based on a comparative analysis of historical data on the capital of Deltic Timber Corporation. The study concentrates on statistical highlights of this corporation’s ratio analysis (debt-to-equity, and gearing levels) and their relationship to financing.
In addition, percentages are used in the analysis to monitor changes over time. Graphs are also used to portray the trend of various variables in the study throughout the analysis. This analysis attempts to reflect on the financial analysis to make an informed deduction on the nature, structure, and form of capital capacity, operative profitability, and investor confidence.
The Economy of the US
The US economy has experienced growth in the GDP from 2006 to date, apart from a brief disruption due to the global economic meltdown in 2009.
As indicated in the table, it is apparent that the GDP of the US increased from $13.314 billion in 2006 to $15.094 billion in 2013. Moreover, the rate of Inflation declined significantly from 3.2% in 2006 to 2.7% in 2013. In the year 2013, the value-added prices increased by 2.1%. In the general manufacturing industry, the construction sector was one of the largest contributors to the acceleration of the value-added prices.
The Natural Resources and Construction Industry
Industry Characteristics
Deltic Timber Corporation operates in the natural resources and construction industry. Over the past decade, the industry has registered steady growth and the same is projected to grow further with the projected decline in the global recession. The key players in this industry include engineering firms, construction resource consultants, and suppliers. However, the industry has to cope with commodity prices rebound due to inflation in vital materials such timber. Thus, the current economic feasibility positioning largely depends on the primary drivers of the industry (Holmes 23).
Sales Characteristics
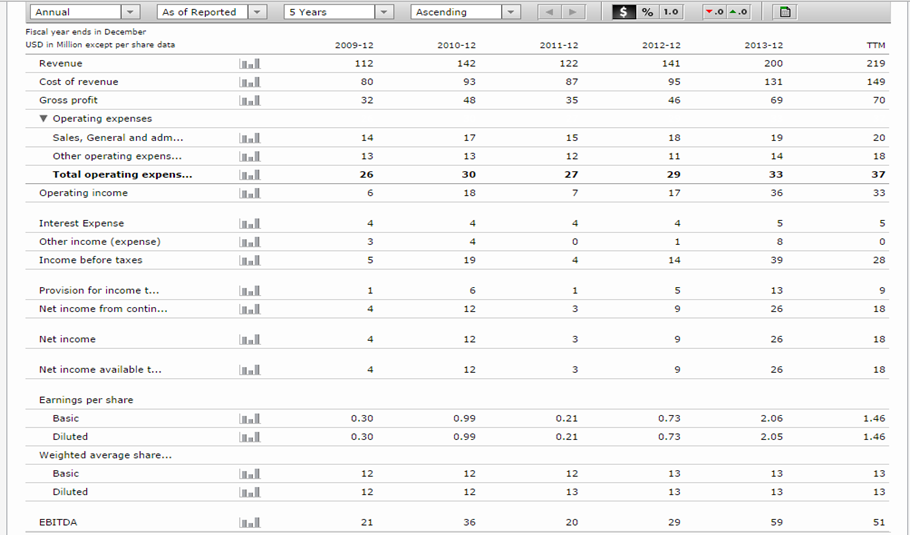
In the recent past, the industry has experienced increases in sales and revenue. This was as a result of the expansion of the business and the opening of new stores. The increase in sales was influenced by the improvement of services and the establishment of a new market niche in the recreational homes services. The incorporation’s net sales increased to $199,702 in 2013 from $121,847 in 2011. This represents a 57.9% increase in sales.
Sources and Uses of Funds
The sources of funding for this incorporation are debt funding and funds from shareholders. In addition, the incorporation resorts to other short-term financing plans such as expansion loans. The production, administration, and distribution channels take the largest part of the funds. In addition, the incorporation does allocate funds for advertisement and research as a strategy meant to improve the quality of their services (Eugene 28).
Causes of Changes in Industry Prospects
The timber construction industry is expected to grow rapidly in the future as demand for low-cost manufactured homes expands. Therefore, the incorporation is expected to further expand its revenues and sales due to the newly created market for green affordable houses in its line of production.
Deltic Timber Corporation
Background and History
Deltic Timber Corporation was founded in 1907. The incorporation has its headquarters in El Dorado, Arkansas. The incorporation has been active in the design and production of timber products that are distributed primarily through the incorporation-owned and independent retailers across the United States of America. Besides the manufacturing industry, the incorporation operates a Real Estate business in the regions of Hot Springs and Little Rock.
Organization of Management
The executive management of Deltic Timber Corporation is made up of five senior personnel. The total number of employees of the organization is more than 1000 personnel in their group of companies. Indicated below is the list of the top management team at the Deltic Timber Corporation.
Products
The incorporation has a series of products and services such as Timber Sales, Lumber, Real Estate, Timberland Management, timber Procurement, Lands for Sale, Chenal Country Club, and Wildlife Management. The most iconic and easily selling products in the Deltic Timber Corporation are the Real Estate and Timber Sales (Deltic Timber Corporation 5).
Market and Distribution Channels
The incorporation sells its products both in the state’s market and across the world. The foreign markets include Canada, Japan, Latin America, and Mexico among others. A large amount of net sales emanates from the US market. The net sales of the incorporation increased to $199,702 in 2013 from $121,847 in 2011. The only marketing risks that the incorporation faces are exchange rate fluctuations in the international markets, changes in customer preferences, and reduced demand as a result of economic fluctuations and barriers to trade (Deltic Timber Corporation 12).
Competition
The natural resources and construction industry in which the Deltic Timber Corporation operates is characterized by stiff competition. The three main competitors are American Woodmark Corporation, Koppers Holdings Inc., Louisiana-Pacific Corporation, and Masco Corporation. However, Deltic Timber Corporation has a greater competitive advantage than its competitors because it offers high-quality products and services.
Production Facilities
The main production facilities of the Deltic Timber Corporation are based in Arkansas, North Louisiana, Waldo, Ola, Hot Springs, and Little Rock. In addition, the incorporation has made use of independent suppliers based in foreign countries such as Japan and Mexico to expand and eat into new markets.
Promotional Activities
Since its establishment in 1907, the incorporation has spent millions of dollars in the research services department aimed at the creation of modern facilities in line with customer preferences. Through investment in new building technology, the incorporation has been able to design greenhouses that come with free services such as underground solar heating, wind fans, and efficient climate control roofing within its Real Estate segment. Moreover, the incorporation spent substantial amounts of money on advertisements and other promotional campaigns.
Acquisitions
The initial Deltic Timber Corporation was founded in 1907. Since then, the incorporation has been able to establish three independent business activities that include recreational services, real estate, and timber sales. These subsidiaries offer support services to each other. In the 2013 fiscal year, the incorporation acquired more than half of the Del-Tin Fiber plant in totality and its distribution chain. The “aggregate gross purchase price was $20 million and is exclusive of transaction costs, specified liabilities assumed and post-closing adjustments” (Deltic Timber Corporation 12). From the above acquisitions analysis of the Deltic Timber Corporation, it is apparent that the acquisition strategy has enabled the corporation to strengthen its market position.
Notes to Consolidated Financial Statements
The financial statements of the company are accompanied by 20 notes. The first note focuses on the accounting policies employed by the company when preparing the financial statements. The second note gives more information on the unauthorized transaction-related costs and recoveries.
The total amount of these transactions amounted to $7,500,000 for the period between 2009 and 2013. The third note gives information on accounts receivables. The fourth note gives information on inventories that is, raw materials, work in progress, finished goods, and reserves for obsolete inventory. The fifth note gives information on equipment and leasehold improvement. The sixth note gives the opening balances, capitalized software cost, accumulated amortization, and closing balances for product software and development expenditure. The seventh note gives information on current and deferred income taxes. The eighth note gives information on the credit facility of the company and the interest rates. The ninth note gives information on accrued liabilities. The next note gives information on product warranty obligation. Notes eleven and twelve give information on deferred compensation and interest expense.
Note thirteen and fourteen give information on income per common and common stock equivalent share and stock option. The fifteenth note gives information on the stock purchase agreement. Note sixteen gives additional information on the cash flow statement. Note seventeen gives the amount the company contributed to the employee benefit plans. The eighteenth note gives a breakdown of foreign sales and significant customers. Note nineteen and twenty give information on commitments, contingencies, and legal matters (Deltic Timber Corporation 12).
Historical Financial Statements
Income statement
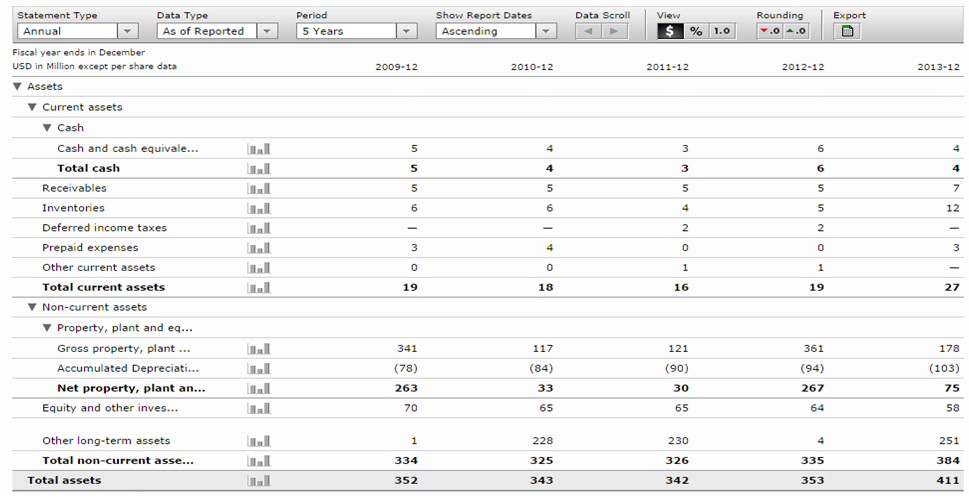
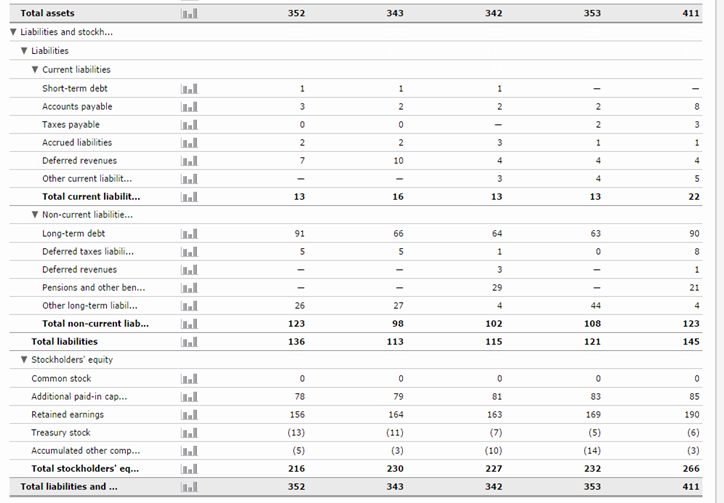
Balance sheet
Continuation
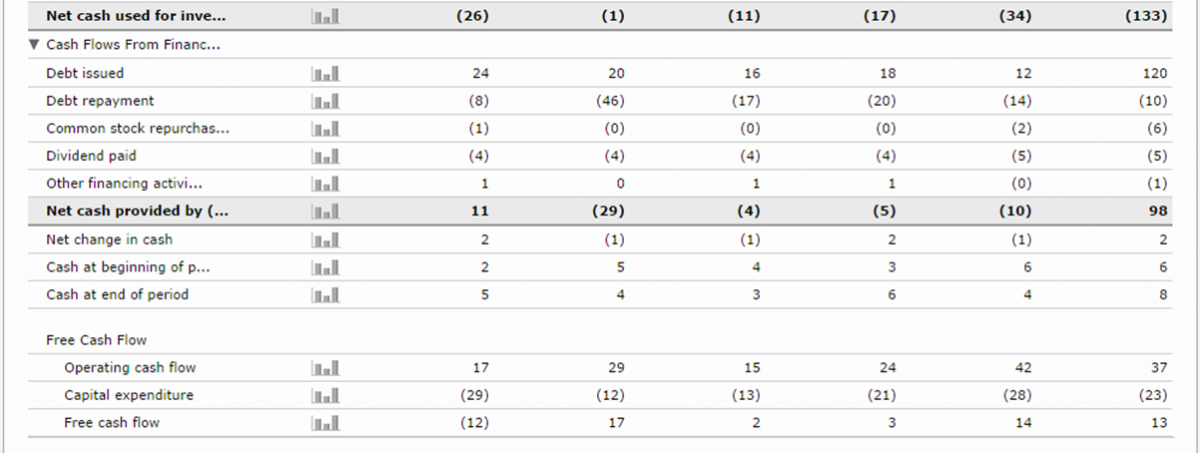
Cash flow
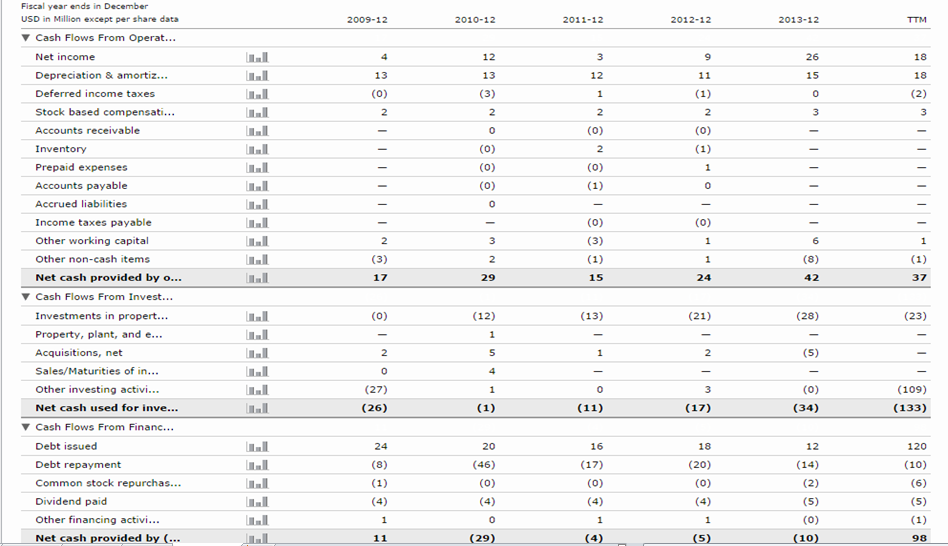
Continuation
Trends in Growth and Variability
The table is presented in appendix 1.
Ratio Analysis
The table is presented in appendix 2.
Initial Pro Forma Financial Statements
In most entities, the Pro-forma financial statements are prepared before the occurrence of an anticipated major financial transaction such as an initial public offer and integrations.
Pro-Forma income statement
The preparation of the Pro-forma income statement will be based on several assumptions. Revenue will grow by 10%, cost of revenue will be 68% of the income earned while other expenses will grow at 9%. Finally, there will be no growth in interest expense. These estimations are based on the growth and trend indicated in the table above. The table presented in appendix 3 shows a summary of the Pro-forma income statement.
Pro-forma balance sheet
The table is presented in appendix 4.
Determination of the Cost of Equity
Cost of equity denotes the value of return shareholders require for their investment. Equity is a significant component of the capital structure. It is worth noting that the amount of debt in the capital structure has an impact on the cost of equity. A high amount of debt increases the risk of equity, thus increasing the risk premium that shareholders will require for their investment. The cost of equity is computed using the capital asset pricing model.
Capital Assets Pricing Model
The required rate of return will be computed using the capital asset pricing model (CAPM). The model is an identity that calculates the required rate of rate by adding a risk premium to the risk-free rate of return. The model takes into account risks arising from the market in which the asset trades. The systematic risk is represented by the beta factor. It gives the amount of risk. The risk premium is the product of the price of risk and the amount of risk.
Cost of equity = risk-free rate of return + beta * risk premium
Risk-free rate
A risk-free rate is the rate of interest that does not have risks such as interest risk fluctuations, default risk, re-investment risk, and currency fluctuations. For the analysis, the interest rate for a 10 year US treasury bond will be the risk-free rate of return. The rate is 3.41%.
Beta
The beta of an asset measures the volatility of a company’s stock relative to the changes in the market. Regression analysis will be used to estimate the value of beta. The results of regression analysis are presented below. The data for the return on shares is presented in appendix 5.
Regression results
Based on the results of the regression, the value of beta is 1.02487.
Expected Rate of Return on a Security
The expected return on a security is 7.16%. The table is presented in appendix 6.
Expected Return on the Market
The expected return on the market portfolio is 9.33%. The data are presented in appendix 7.
Market risk premium
Risk premium can be defined as the incentives for investing in a risky asset. The risk premium is the amount over and above the risk-free rate of return. Thus, it will be the difference between the expected return on the market portfolio and the risk-free rate.
Market premium = expected return on market portfolio – risk free rate
= 9.33% – 3.41% = 5.92%
Calculation of Cost of Capital
Cost of equity = risk free rate of return + beta * risk premium
= 3.41% + (1.02487 * 5.92%) = 9.4772%
Determination of the Cost of Debt
Cost of debt = (risk free rate + default spread) (1 – t)
Risk free rate = 3.41%
Default spread = 0.6
Tax rate = 34% (corporate tax in the US is 34%)
Substitute the values (3.41% + 0.6)0.66 = 2.646%
Determination of the Weighted Cost of Capital
Valuation
The valuation will be based on several assumptions. First, the growth rate will be 10% during the high growth rate period followed by 8% and 5%during the low growth rate period. The tax rate is 30%. The operating margin is 17.86% of sales while the EBIT margin is 19.44%. The table presented below shows the summary of the valuations.
Therefore, the cash flows generated above will be used to calculate the net presented value using the weighted average cost of capital.
The current market price of the firm’s stock is $66.58. The estimated price is $62.48. This implies that the price of the stock is undervalued. Therefore, there is a high probability that the price will rise.
Optimal capital structure
The calculation of the optimal capital structure will be based on the following assumptions.
Other data
The table presented below shows sensitivity analysis and estimation of the optimal capital structure.
Based on the table above, it can be noted that the optimal capital is at the point the weighted average cost of capital is 9.06%.
Summary and Conclusion
The nature of a company defies its financial position. Comprehensive analysis of the financial performance of a company like Deltic Timber Corporation may prove complex since it operates more than one segment existing independently of the other. As indicated in the above analysis, it is apparent that the profitability of this multinational company has remained steady despite slight variances noted across the five years.
Despite dismal performance in 2010, Deltic Timber Corporation has exhibited steady capital structure and dividend though earnings per share declined. From the ratio analysis, it is apparent that the company is in a steady position to benefit from competitive advantage, while at the same time expanding without serious difficulties as it has displayed consistency in performance over the years.
Works Cited
Deltic Timber Corporation 2013, Annual Report 2013. Web.
Eugene, Brigham. Financial management theory and practice, USA: South-Western Cengage Learning, 2009. Print.
Holmes, Green. Interpreting company reports, New York: Harlow, 2008. Print.
Appendices
Appendix 1 growth
Appendix 2 – ratios
Appendix 3
Proforma income statement
Appendix 4
Proforma balance sheet
Appendix 5
Return on shares
Appendix 6
Expected return on security
Appendix 7
Expected return on the market