Company Overview
Coca-Cola: A Brief Background
Coca-Cola is considered as the largest and most successful beverage company in the world. According to Weygandt, Kimmel, and Kieso (2012), the company started its production in 1886. Over the years, it has become an international brand in the world market. The main products associated with the brand are mostly non-alcoholic drinks. The company manufactures a number of soft drinks, most of which are carbonated. However, it is important to note that with time, Coca-Cola has diversified into the noncarbonated beverages market. To this end, it has started engaging in the production of fresh juices and mineral water. The major consumers of Coca-Cola products are people from diverse backgrounds. In light of this, it is apparent that the brand is spread out globally across 200 different countries.
The performance of an organisation depends on the efficiency of its leadership structure. In this regard, Coca-Cola has a two tier leadership formation. The Board of Directors assumes the executive position in the company. The body makes the major decisions touching on the operations of the organisation. The second tier is divided into functional and operational leadership. The two clusters have a synchronised mode of operation. The structure is aimed at ensuring that the company meets its core objectives.
Pepsi Company: An Overview
Pepsi is an American company whose history goes back to 1893. The organisation is based in North Carolina. Like Coca-Cola, Pepsi is also involved in the production of soft drinks, snacks, and other non-carbonated beverages (Weygandt et al., 2012). Some of the products associated with this company include, Pepsi-Cola, 7-Up, and Cheetos. A company like Pepsi requires a stable logistical partner to ensure that the products reach the intended market within the set timelines. Such partners make up the organisation’s supply network. Presently, the multinational company controls about 30% of the global soft drinks market (Nasdaq, 2014). The products of the company appeal to a wide range of consumers in contemporary global market.
Pepsi owes its performance in the competitive soft drinks market to an effective organisational structure. According to Weygandt et al. (2012), the company has a three tier organisational formation. At the top is the Board of Directors. The board makes the major decisions for the company. It is deputised by four regional heads. The administrative and operational level comes last.
Gross, Operating, and Net Profits: Profitability Ratios for Coca-Cola and Pepsi
Investment decisions in the modern global market are arrived at based on a comprehensive evaluation of a company’s performance. Based on this perspective, it becomes clear that financial statements provide the best point of reference with respect to the performance of a future or potential business partner (Weygandt et al., 2012). In light of this, financial analysts focus on the gross, operating, and net profit ratios. Each of these ratios can be obtained from the financial statements of the subject company. For the purposes of the analyses in this paper, the ratios are computed using the 2013 financial statements for Pepsi and Coca-Cola companies.
Gross, Operating, and Net Profit Ratios for Coca-Cola Company
The gross profit ratio is obtained by dividing operating profits with revenues. In the financial statements of this company, revenue is reported to be $46.854 billion (Berfield, 2014). On the other hand, the gross profit is $28.433 billion (Berfield, 2014). The calculations below give the profitability ratios for Coca-Cola in the 2013/2012 fiscal year:
Ratios for 2013 financial year
Gross Profit Ratio = 28.433 ÷ 46.854 = 0.61.
Operating Profit Ratio = 10.228 ÷ 46.854 = 0.22.
Net Profit Ratio = 32.655 ÷ 46.854 = 0.70
Ratios for 2012 financial year
Gross Profit Ratio = 28.964 ÷ 48.017 = 0.60.
Operating Profit Ratio = 19.50 ÷ 48.017 = 0.41.
Net Profit Ratio = 44.847 ÷ 48.017 = 0.93.
Gross, Operating, and Net Profit Ratios for Pepsi Company
The performance of Pepsi is evaluated based on the following calculations of the respective profitability ratios:
Profitability ratios for 2013 financial year
Gross Profit ratio = 35.17 ÷ 66.42 = 0.53.
Operating Profit Ratio = 46.28 ÷ 66.42 = 0.70.
Net Profit Ratio = 38.049 ÷ 66.42 = 0.57.
Profitability ratios for 2012 financial year
Gross profit ratio = 34.20 ÷ 65.49 = 0.52.
Operating Profit = 9.23 ÷ 65.49 = 0.14.
Net Profit Ratio = 37.531 ÷ 65.49 = 0.57.
A Summary of the Performance of Coca-Cola and Pepsi Companies
From the analysis conducted on the financial statements, it is clear that Coca-Cola witnessed an increase in the operating and net profit ratios. However, the gross profit ratio declined slightly. With respect to Pepsi, the gross and operating profits increased between 2012 and 2013 financial years. However, the net profit ratio remained the same during this period. According to Weygandt et al. (2012), the financial health of a company depends on the average performance of the profit ratios. A comparison of the ratios obtained for the two companies suggests that Pepsi performing better financially compared to Coca-Cola. However, from the calculations illustrated, it emerged that Coca-Cola recorded significant surges in the profitability ratios compared to Pepsi.
The management at Coca-Cola and Pepsi can put in place a number of measures to improve their profit ratios. To start with, the management at both companies should strive to strike a balance between operational costs and the attainment of projected profits (Weygandt et al., 2012). Based on several industry researches, it has emerged that outsourcing of non-essential processes can help reduce on the operational costs. The operational costs of both companies are relatively high (AmigoBulls, 2012). A reduction in such costs will trigger a rise in profit ratios.
Recent News Events Affecting the Financial Performance of Coca-Cola and Pepsi
The financial performance of an organisation is affected by both external and internal factors. External agents include acquisitions, mergers, and political developments. Such factors influence the performance of the company on matters relating to cost, profits, and income (Weygandt et al., 2012). Since 2012, a number of news events have affected the operations of both Pepsi and Coca-Cola companies. Potential investors and creditors make their decisions based on how a company responds to such external factors
Coca-Cola’s News Events
Since 2012, Coca-Cola has hit the headlines due to a number of reasons. For example, the company has been on an acquisition spree. In addition, it has been engaged in a number of politically instigated court cases. According to Berfield (2014), whenever such incidences occur, the financial performance of a company is affected. For instance, Coca-Cola has had longstanding battles with lobby groups regarding its mode of advertisement. In one incident, a company called Pom Wonderful successfully got injunctions to sue Coca-Cola for misrepresenting facts regarding one of its soft drinks. Coca-Cola was accused of bolstering the sales of its Pomegranate Juice product by claiming that it was 100% natural. However, it was revealed that the quantity of the fruit in the drink was about 0.3%.
In other instances, Coca-Cola has acquired a number of companies since 2012 (The Coca Cola Company, 2013). The organisation has been expanding its portfolio by acquiring companies with similar business strategies. The most recent acquisition involved the taking over of ZICO Pure Premium Coconut Water. The deal was sealed in 2012. The company is keen on increasing its customer base and revenues given the level of competition in the soft drink industry.
The two news events have had various impacts on Coca-Cola. In the first case, the order to repackage its products presented a logistical challenge. The result would be a spike in operational costs. However, the ruling was not cast in stone. Coca-Cola has a strong backing of Federal Laws, which may ensure that it does not have to repackage the products. Such a move will minimise the chances of increasing operational costs. On the other hand, the acquisition broadens the client base of Coca-Cola. It implies a potential rise in revenues. Based on these two news events, potential investors and creditors would be wary of a financial commitment. They may prefer to wait until the court case is concluded and the proposed revenues realised.
Pepsi’s News Events
The soft drink sector is characterised by claims that companies are selling unhealthy products given the high levels of calories. In this regard, Pepsi and Coca-Cola have a joint undertaking to reduce the levels of calories in their beverages (Strom, 2014). The move was prompted by an increasing number of consumers demanding for healthier products. Pepsi also has its fair share of corporate politics. The California State Teachers Retirement System (Calstrs) has proposed their preferred candidate (Nelson Peltz) to join the Pepsi Board. Peltz is on record as having advocated for the separation of the beverage and snack businesses, a move rejected by the board. The conflict may result in proxy wars in the company.
A potential investor or creditor would be hesitant to partner with Pepsi based on the two news event. In the first instance, Pepsi has not obtained an edge over its competitors (Stevenson, 2014). The move to reduce calories is a joint effort with rivals. In addition, the looming proxy war is a threat to the brand. In both news events, Pepsi is depicted as a risky investment partner. There are no convincing grounds that the company will weather the storms. To this end, creditors and investors will be cautious to enter into a joint business venture with Pepsi.
Analysis of Income Statements for Coca-Cola and Pepsi
Investment analysts establish the performance of a company based on the information provided in the income statement. Such details are compared to those presented by other companies to help an investment analyst evaluate the entity that has outperformed the other. According to Weygandt et al. (2012), such an analysis can help improve the income of the companies that lag behind their competitors. The main aspects to consider include the cost of goods sold, operating charges, revenues, and operating income
Evaluating the Income Statements of Coca-Cola and Pepsi
In 2012, the cost of goods sold by Coca-Cola was $19.053 billion compared to $18.421 billion recorded in 2013 (refer to appendix 1). A similar trend was observed with respect to the net operating revenues. In 2012, the figure stood at $48.017 billion compared to $46.854 billion in 2013. With respect to gross profits, there was a decline from the 2012 figure of $ 28.964 billion to $28.964 in 2013.
The average sales growth rate for Pepsi was 3.92% between 2012 and 2013 (see appendix 2). However, cost of sales increased by 13.7%. According to Weygandt et al. (2012), a high growth rate of cost often lowers a company’s gross profit. In the case of Pepsi, the figures differed by 4.45% for the two years. The annual cost of operation and growth rate stood at 5.74%. The figure is slightly lower compared to the average sales growth rate. In 2013, Pepsi maintained its operating costs below sales growth rate to protect its operating profit margin.
Coca-Cola Lags Behind
The growth rate for Coca-Cola was slightly slower than that of Pepsi. However, the former maintained its gross profits, which were below the sales growth rate. The figures suggest that Coca-Cola succeeded in controlling the cost of production by buying at lower prices. Such companies are also known to make use of effective commodity hedging to help sustain a low production cost. Unfortunately, Coca-Cola’s net profit recorded a drop of 5.22% in comparison to Pepsi’s 9.78%.
Evidently, Coca-Cola is lagging behind its competitor. The major reason is the decline in revenues. According to Weygandt et al. (2012), a decline in revenues can be resolved through improved marketing strategies to net more customers. In the previous section, it was illustrated that Coca-Cola’s acquisition of a new company will boost its revenue. Consequently, the company needs to minimise its production costs by outsourcing and transferring extra costs to strategic marketing.
Analysing the Balance Sheets of Coca-Cola and Pepsi
Analysing the Balance Sheets
Coca-Cola
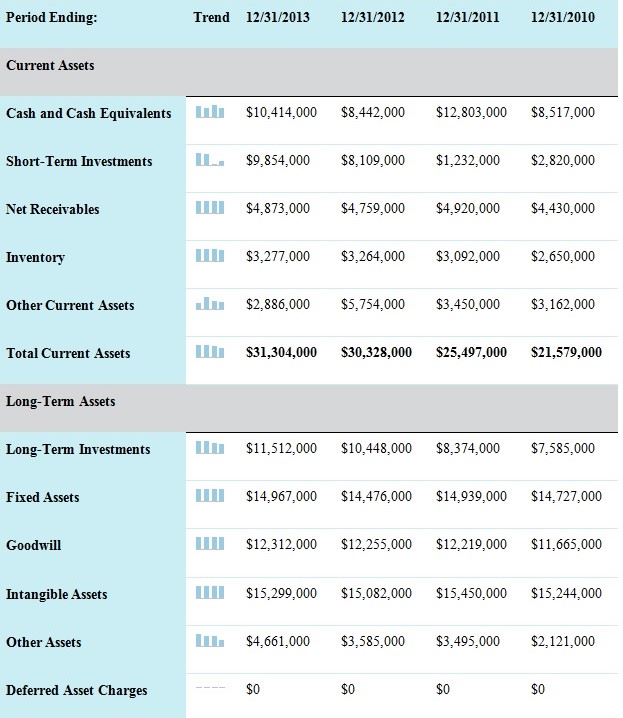
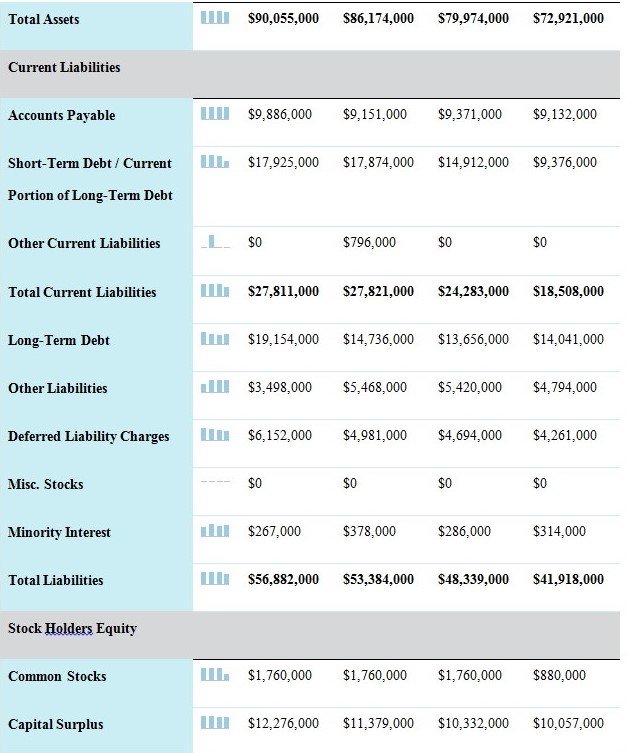
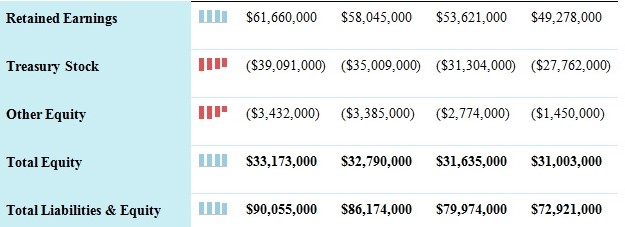
In 2012, Coca-Cola had an asset value of $86.174 billion. The figure was relatively lower to the $90.055 billion recorded in 2013. The liabilities decreased from $27.821 billion in 2012 to $ 27.712 billion in 2013. The total equity increased from $33.168 billion in 2012 to $33.440 in 2013. In general, Coca-Cola’s balance sheet reflects growth in assets. The reduction of the liabilities is an indicator that the company is credit worthy and can attract potential investors.
Pepsi
In 2012, the total assets for Pepsi stood at $74.64 billion. There was a remarkable increase in assets in 2013, which recorded a total of $77.48 billion. Pepsi recorded a slight increase in its liabilities from $52.24 billion to $53.09 billion. $ 22.4 billion was the amount of shareholders equity in 2012. The figure was relatively lower compared to the $24.39 billion recorded in 2013.
Interpretation of Results and Financial Report
The asset and liabilities of Coca-Cola are more compared to those of Pepsi. The disparity is attributed to the increased spending by the former. Pepsi, on the other hand, has a low operating capital. Companies with such indicators often lag behind in asset acquisition. Both organisations are attractive to an investor based on the decline in liabilities and increase in assets. However, Pepsi is more favourable to an investor compared to Coca-Cola given the low value of liabilities. Coca-Cola can improve its appeal to potential investors engaging in a massive reduction of liabilities.
References
AmigoBulls. Pepsi balance sheet 2013, 2012. Web.
Berfield, S. (2014). Supreme Court rules that POM can sue Coca Cola over misleading label. Web.
Nasdaq. (2014). KO Company financials. Web.
Stevenson, S. (2014). Nelson Peltz’s efforts to shake up get backing from Calstrs. Web.
Strom, S. (2014). Soda makers Coca-Cola, PepsiCo, and Dr. Pepper join in effort to cut Americans’ drink calories. Web.
The Coca Cola Company. (2013). ZICO beverages joins the Coca-Cola family. Web.
Weygandt, J., Kimmel, D., & Kieso, E. (2012). Financial accounting. New Jersey: John Wiley & Sons.
Appendix 1: Coca-Cola Financial Statement
Annual Income Statement (values in 000’s)